My Thoughts
Short-form commentary on macro, market structure, commodities, Bitcoin, crypto markets, and AI.

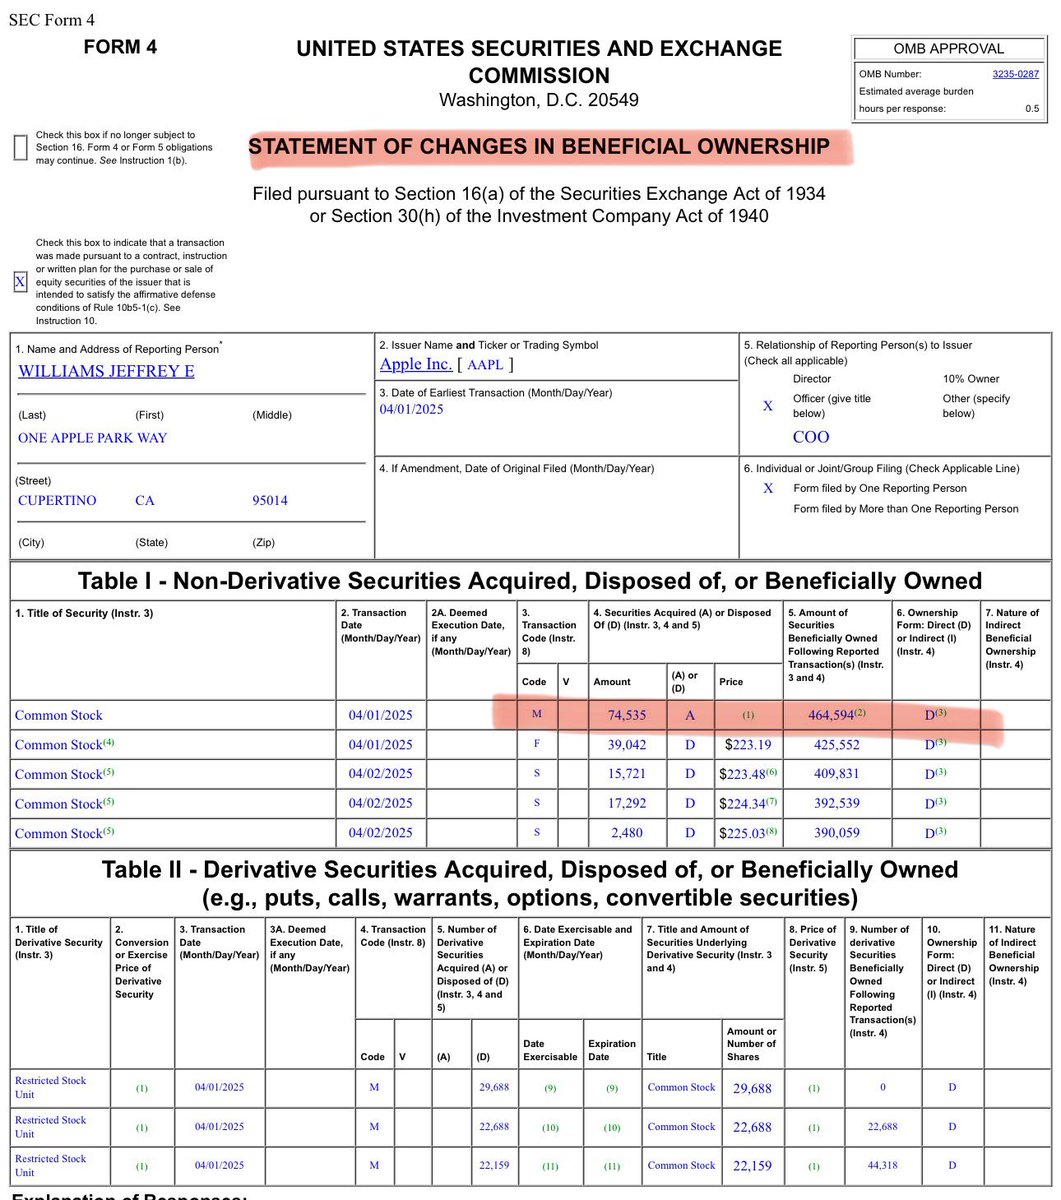
TIL that you can pay taxes on vested securities/equities directly with that security
Code F on Form 4
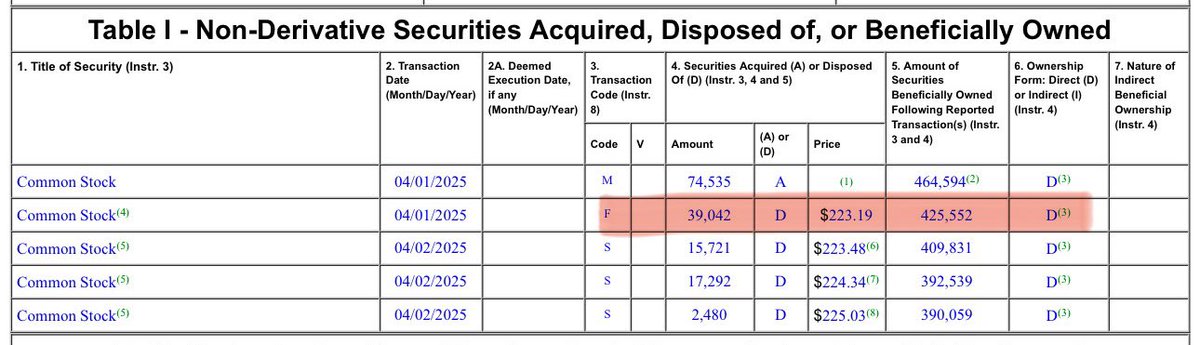
Insider Trading Before Tariffs
If you're curious about how insiders were buying/selling their equity positions, head over to @SECGov's EDGAR & check for Form 4 & 3 filings
Here's the latest one from $AAPL
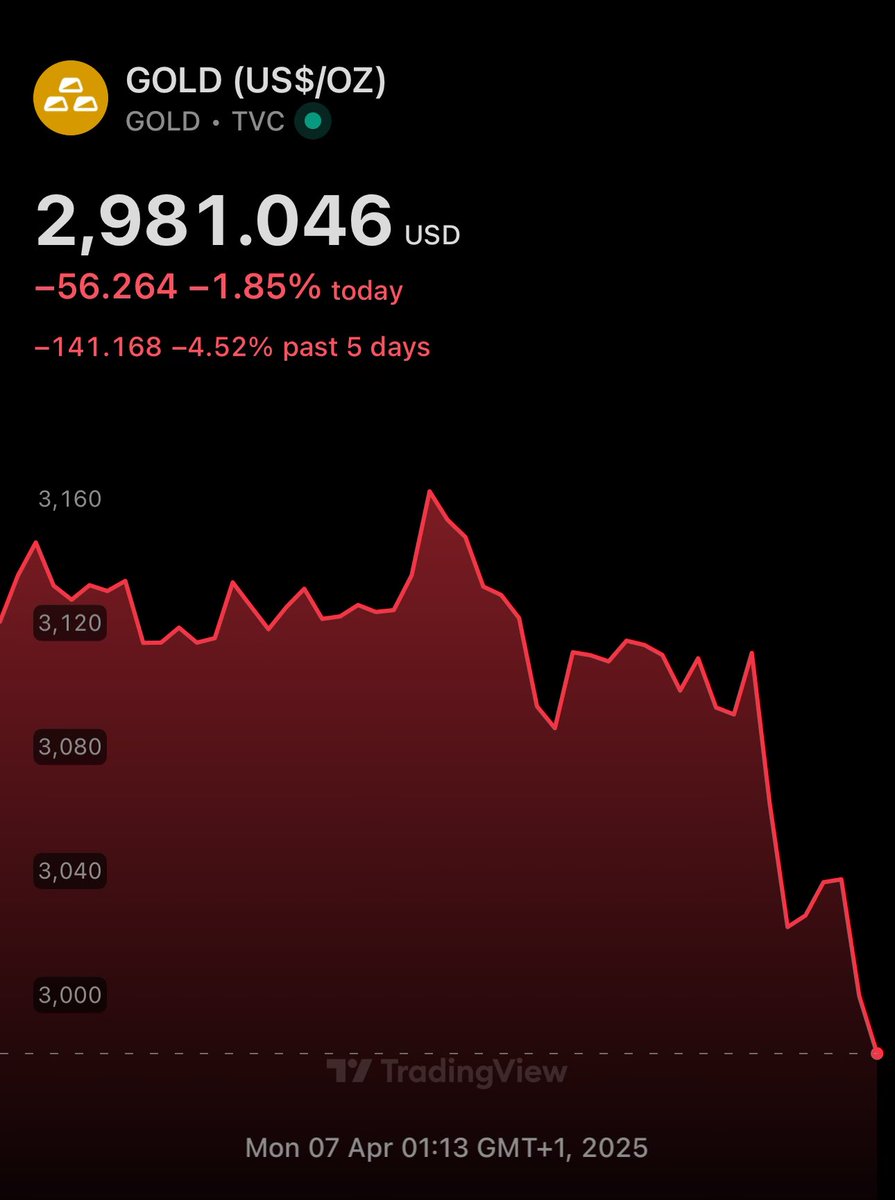
Gold is down 6% from its ATH
Still better than equities, crypto & silver
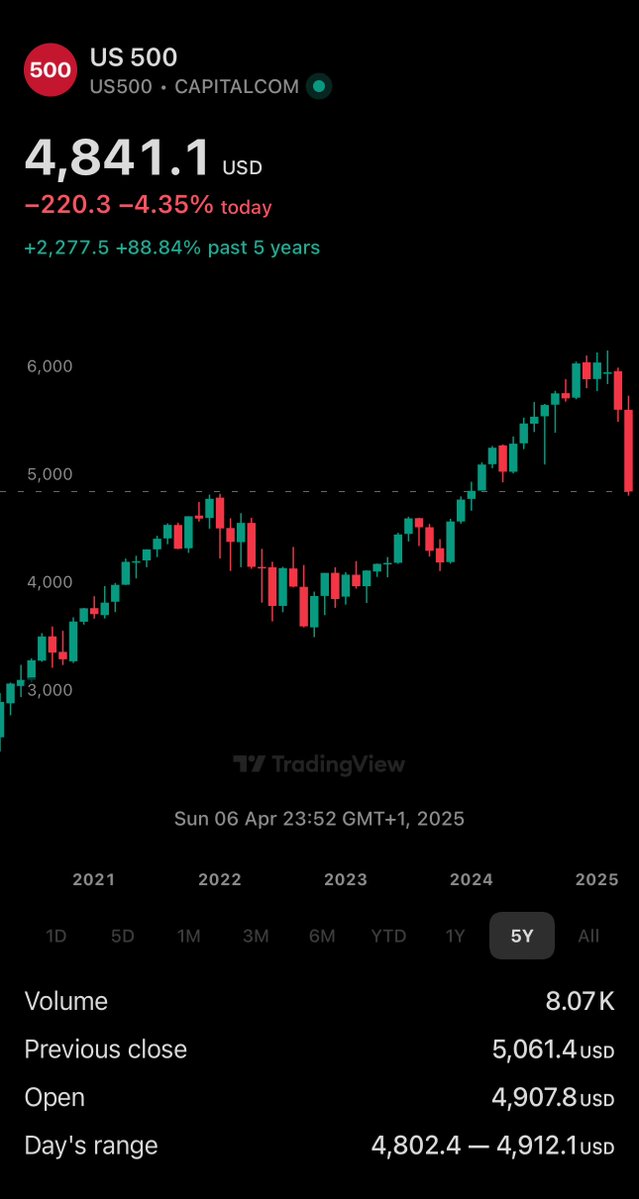
🚨BREAKING: S&P 500 Fell to 2021 Prices
#SPX futures / #US500 is down almost 5% since open
≈4 years of gains have been lost
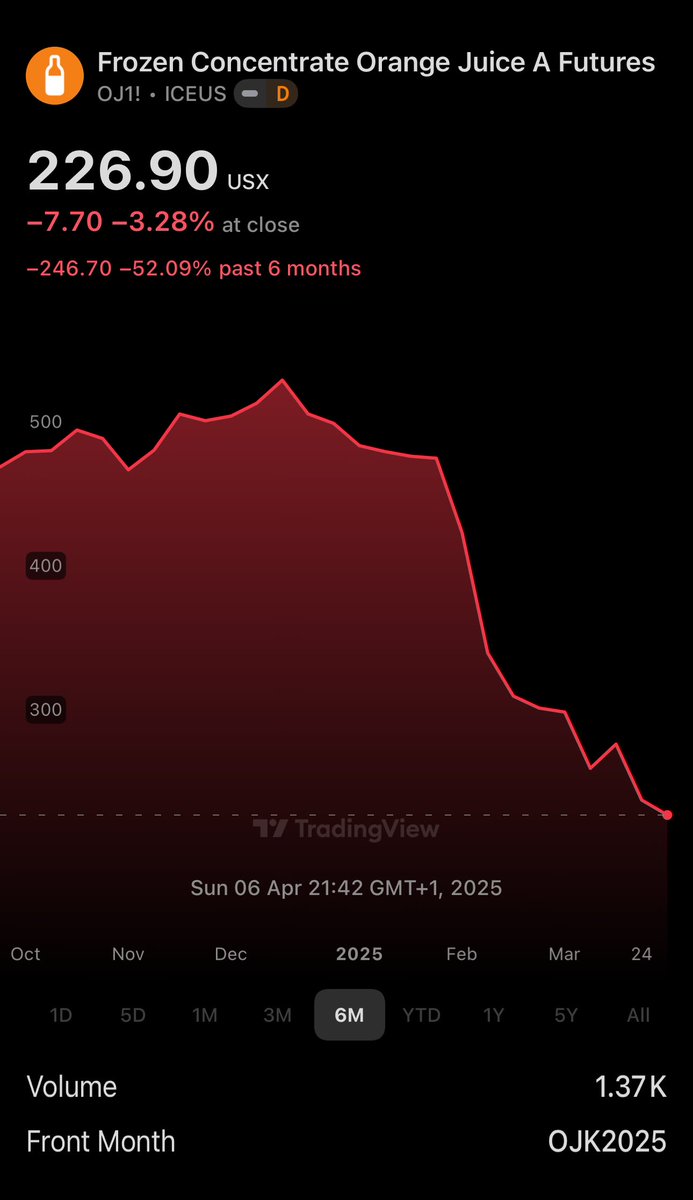
Tariffs are just a distraction from the fact that orange juice futures are down over 50% 🍊
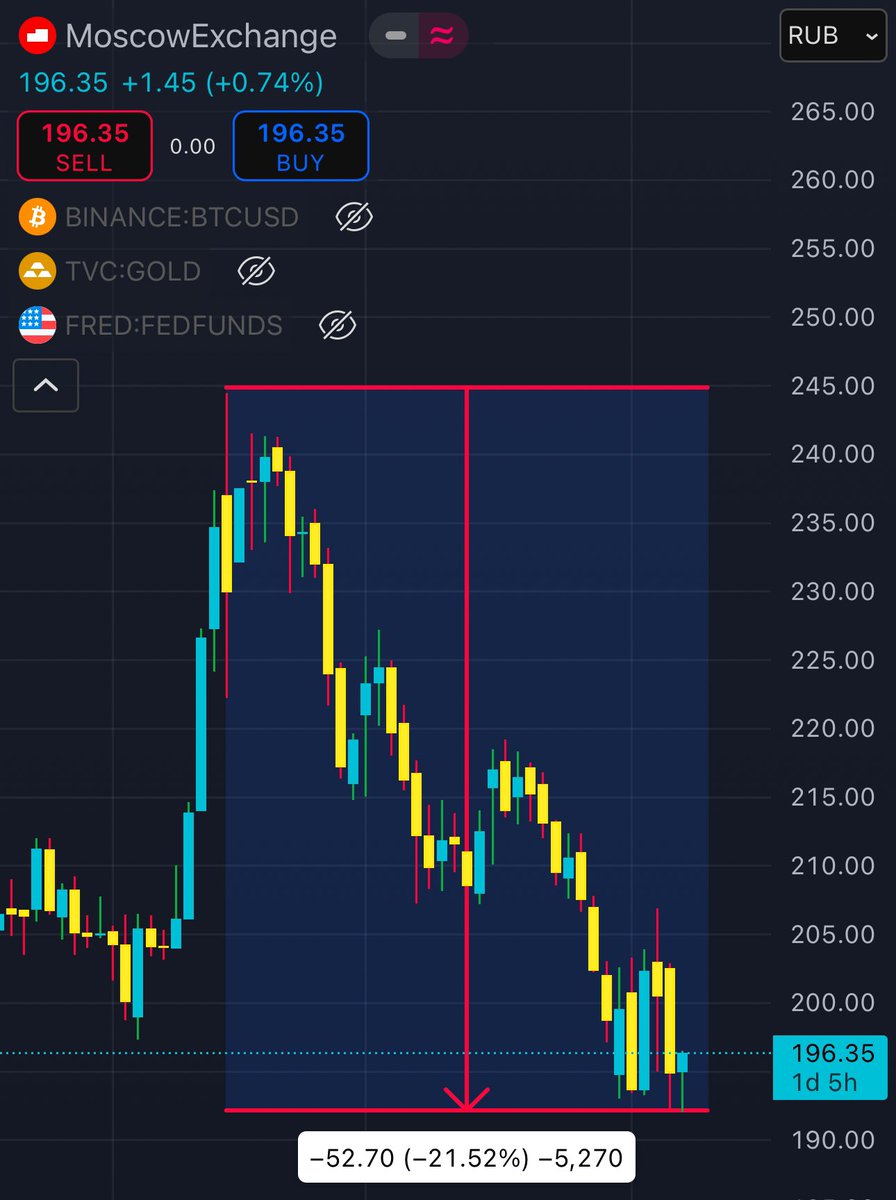
🇷🇺 #MOEX down 22% since Feb
Expect it to bounce back very soon - as capital is moved away from USA & USD into alt currencies, which includes Ruble
Once the sanctions against Russia are dropped - that's where Moscow Exchange Index will skyrocket 📈 http
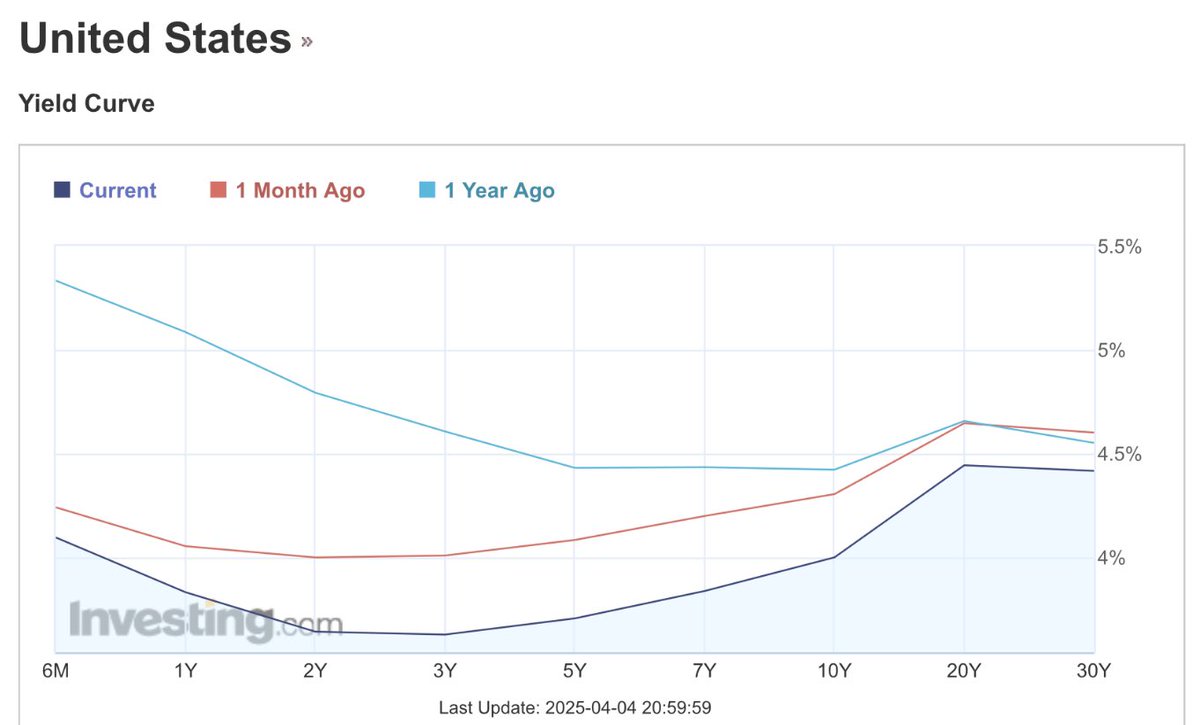
🚨 US Yield Curve UPDATE
Despite the falling $DXY, the yield curve is better (less inverted) than a 1y ago, but worse than 1 month ago
Expect a steeper inversion soon
This tariffs-induced volatility is the dream of every trader
Clearing houses are banking from fees & comissions
Finally, risky-assets/DeFi/crypto volatility coming to your favorite regulated exchange
What's even the point of all the regulations in TradFi?
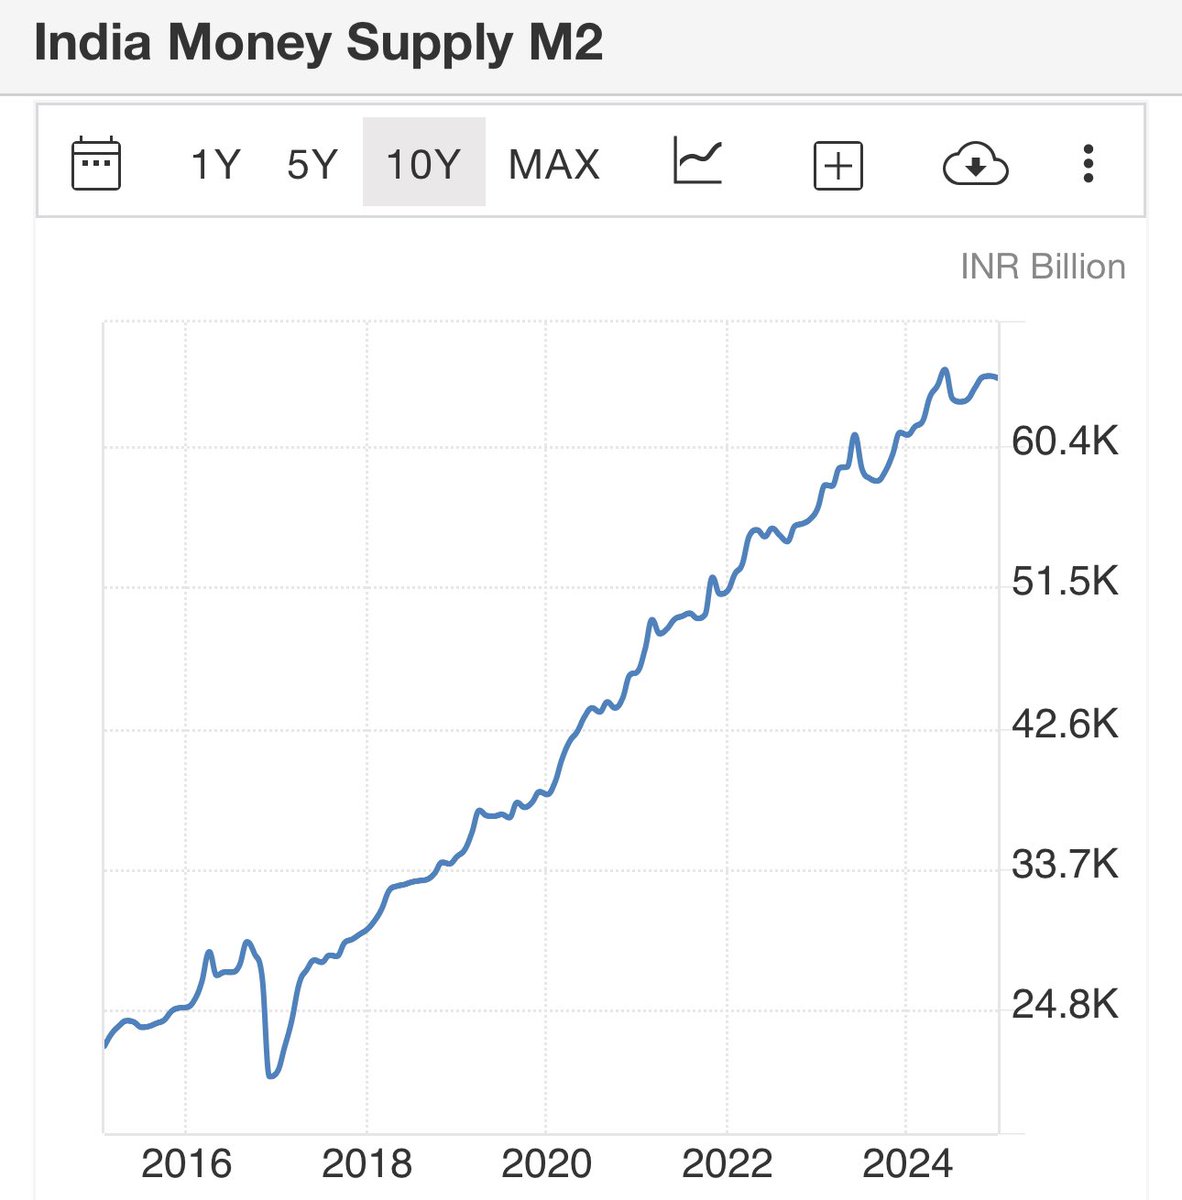
🇮🇳 Indian Rupee's M2 supply makes it even worse
Net importer + currency inflation is a recipe for depreciation and external dependence
🇧🇷🇷🇺🇮🇳🇨🇳🇿🇦 BRICS & Tariffs
Amid the collective chaos there is a group of nations set to benefit from President Trump's tariffs
HINT: it's not the USA ❌🇺🇸
BRICS got geopolitical justification for their existence
Tariff-free zone + local currency trade acts as insurance http
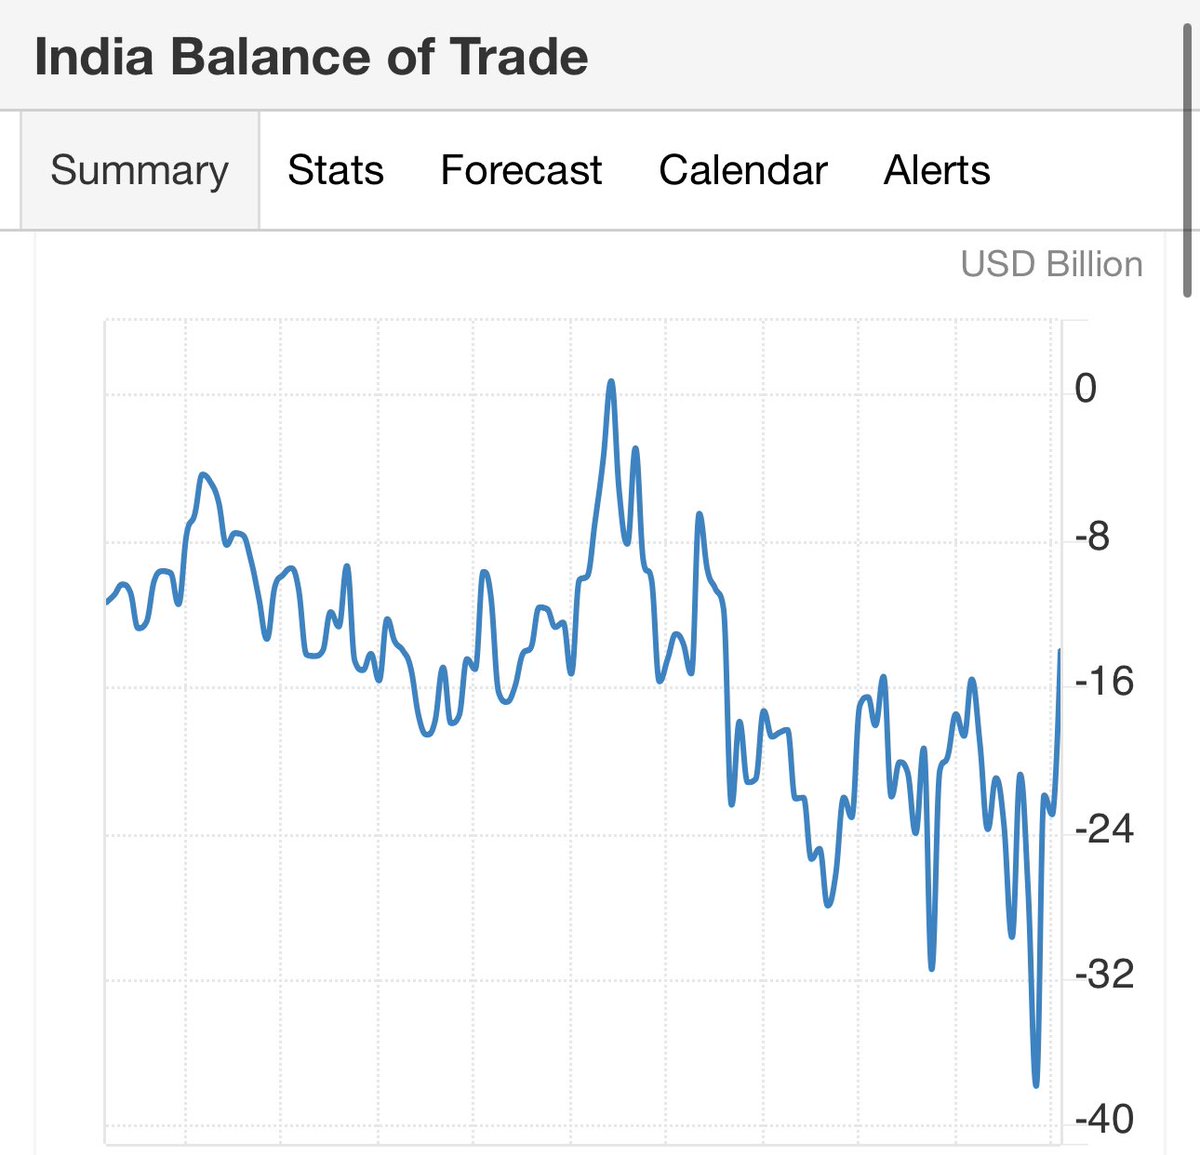
🇮🇳 India has accumulated a massive trade deficit
India imports from China, Russia & then exports to USA & UAE. The imports are also similar to exports & a lot of it is re-exports
This deficit isn't sustainable of course https://t.co
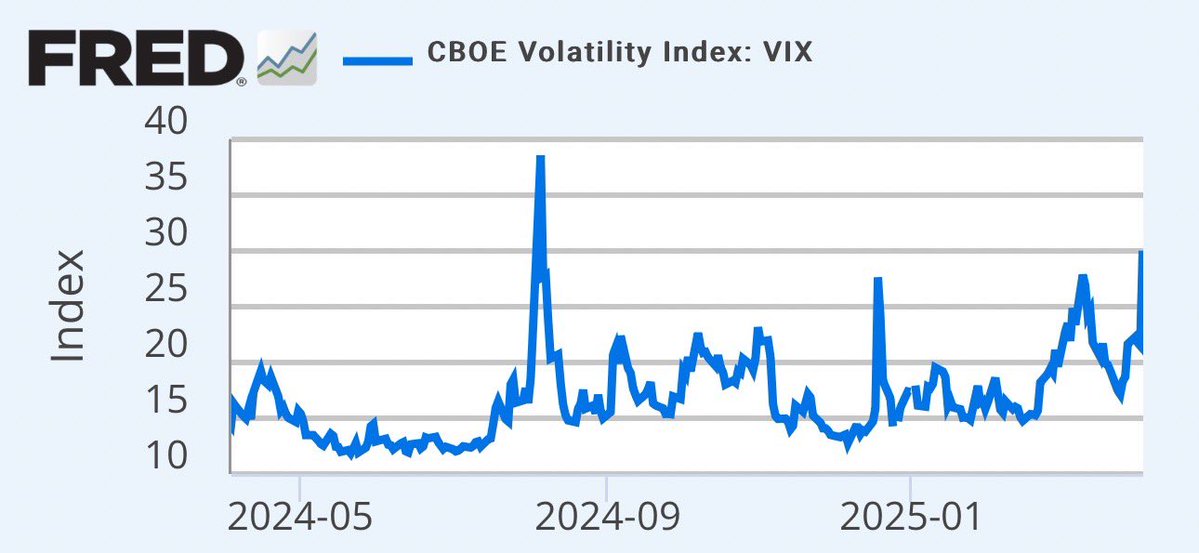
$VIX is a measure of expected volatility
It's computed from option prices. The price of the option is the insurance/premium that the option seller/short charges
So higher option price = protection against more volatility
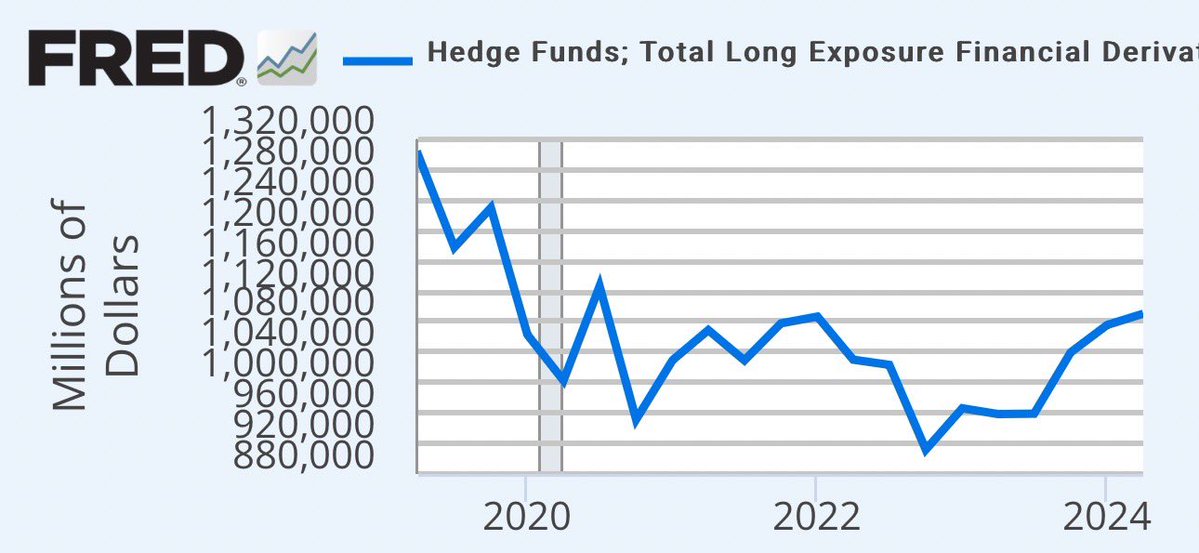
Institutional longs were just reaching 2022 levels at Q2 2024
How do you think Q2 2025 will look like?
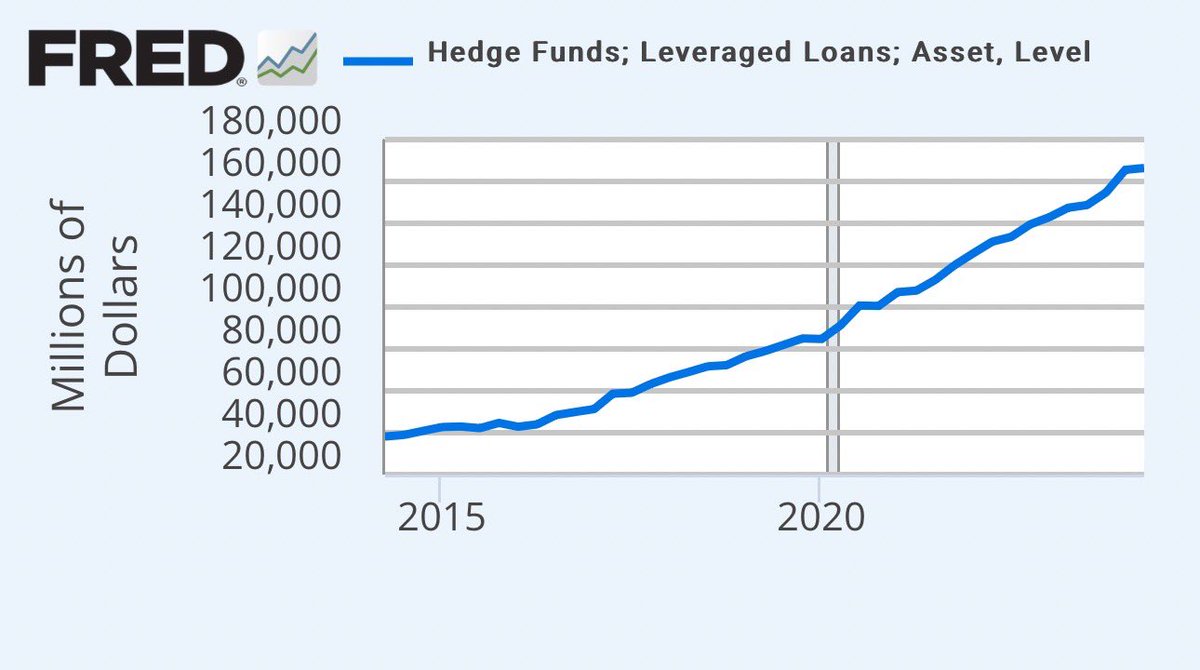
Hedge Funds & High-Risk Loans
Leveraged loans are loans issued to high debt/risk entities - akin to subprime loans
Tariffs will hurt solvency. Only way out is FED lowering interest rates, so the debt can be refinanced cheaper
Otherwise the house of cards falls
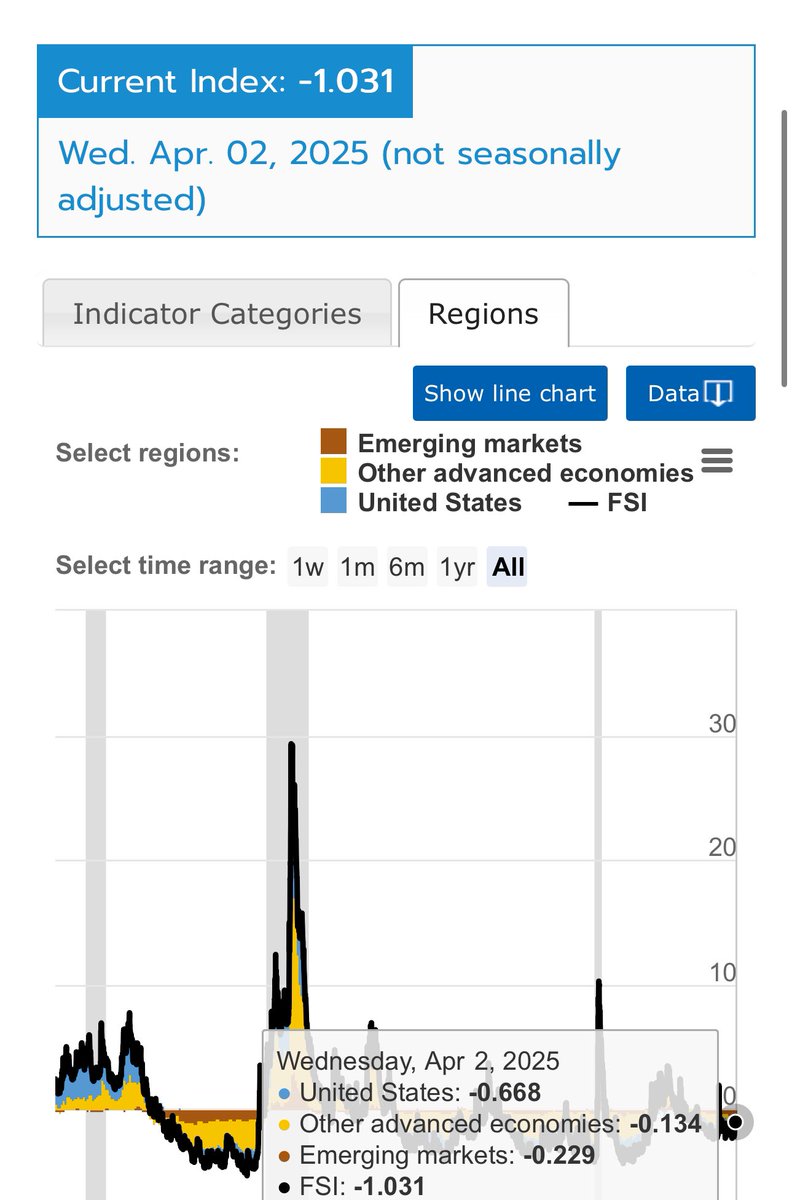
Financial Stress Index (FSI) UPDATE
as expected, the risk is increasing
Sustained volatility will drive the rest up
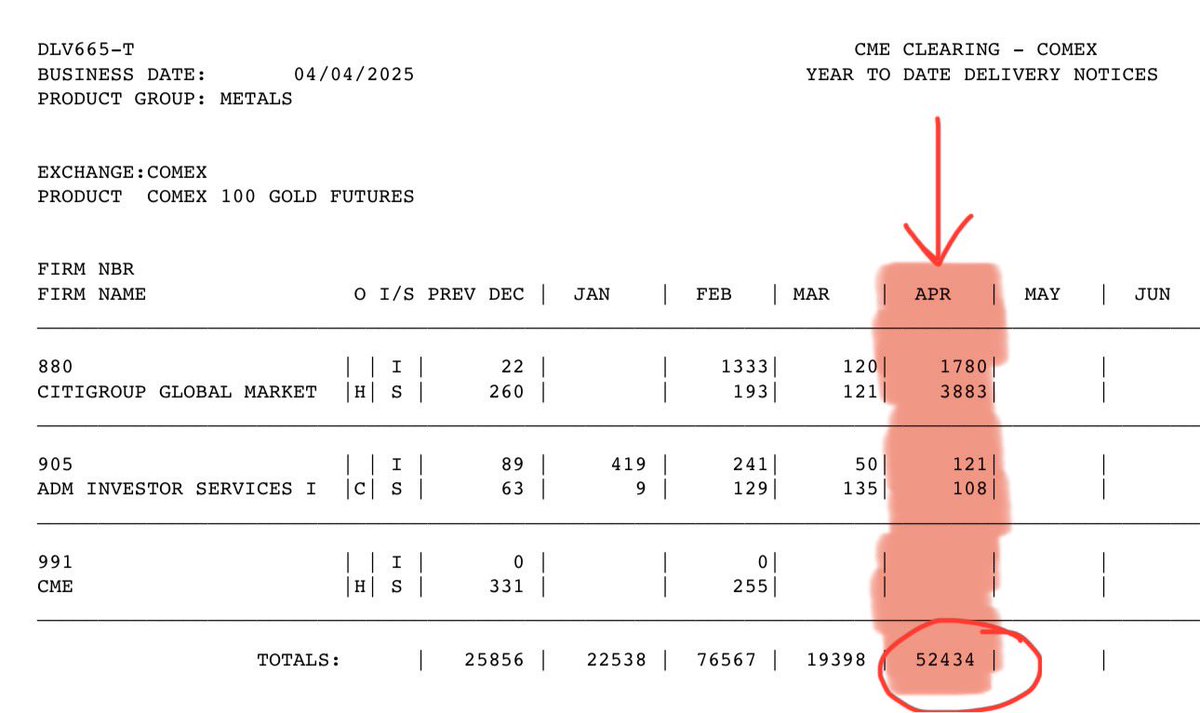
PHYSICAL GOLD RUSH
It's not just Central Banks anymore
In the first 4 days of April 2025, over 52K COMEX 100 Gold Futures contracts have been requested for physical delivery
Only 4 days in & it's already x2 of January interest
Physical gold in high demand
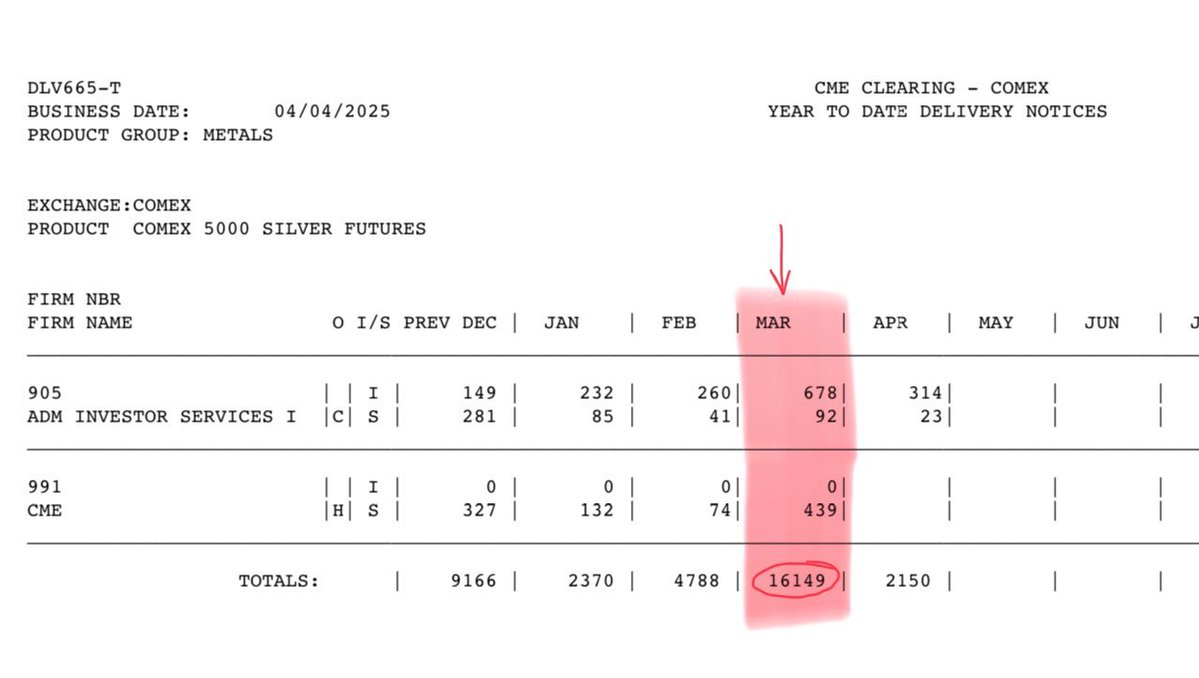
Silver Physcial Delivery Demand HIGH
CME's COMEX & NYMEX Metal Delivery Notices show a MASSIVE demand for physical silver
16.1K futures contract for delivery/physical settlement, up x3 from a year ago
A.K.A. tariffs effect on silver
Investors are HOARDING silver
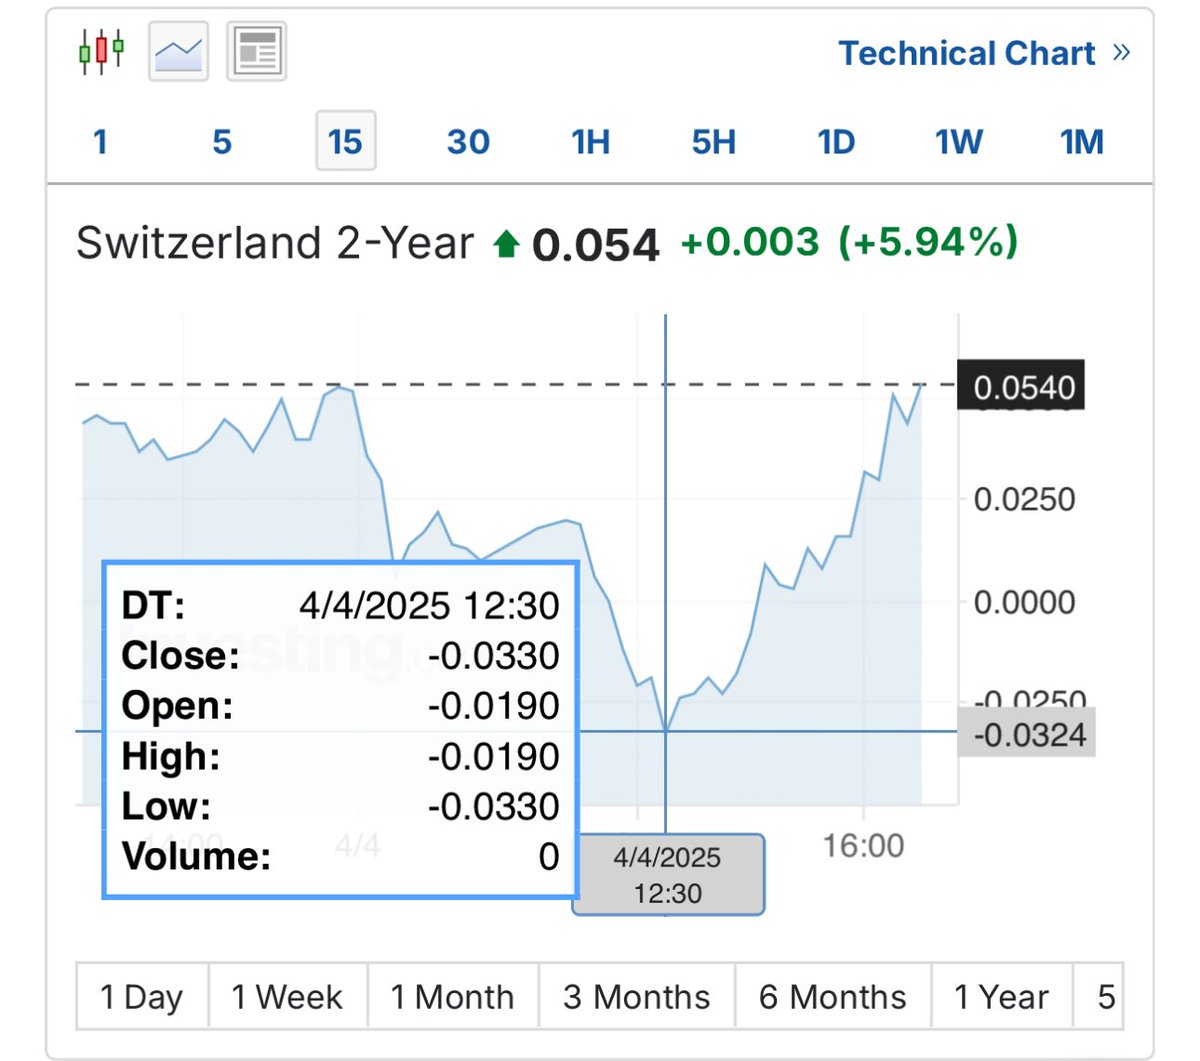
Switzerland 2 year bond yield went negative
Swiss Frank appreciates against major currencies like #EUR & #USD, so investors accept lower (sometimes even negative!) yields
Massive demand for #CHF
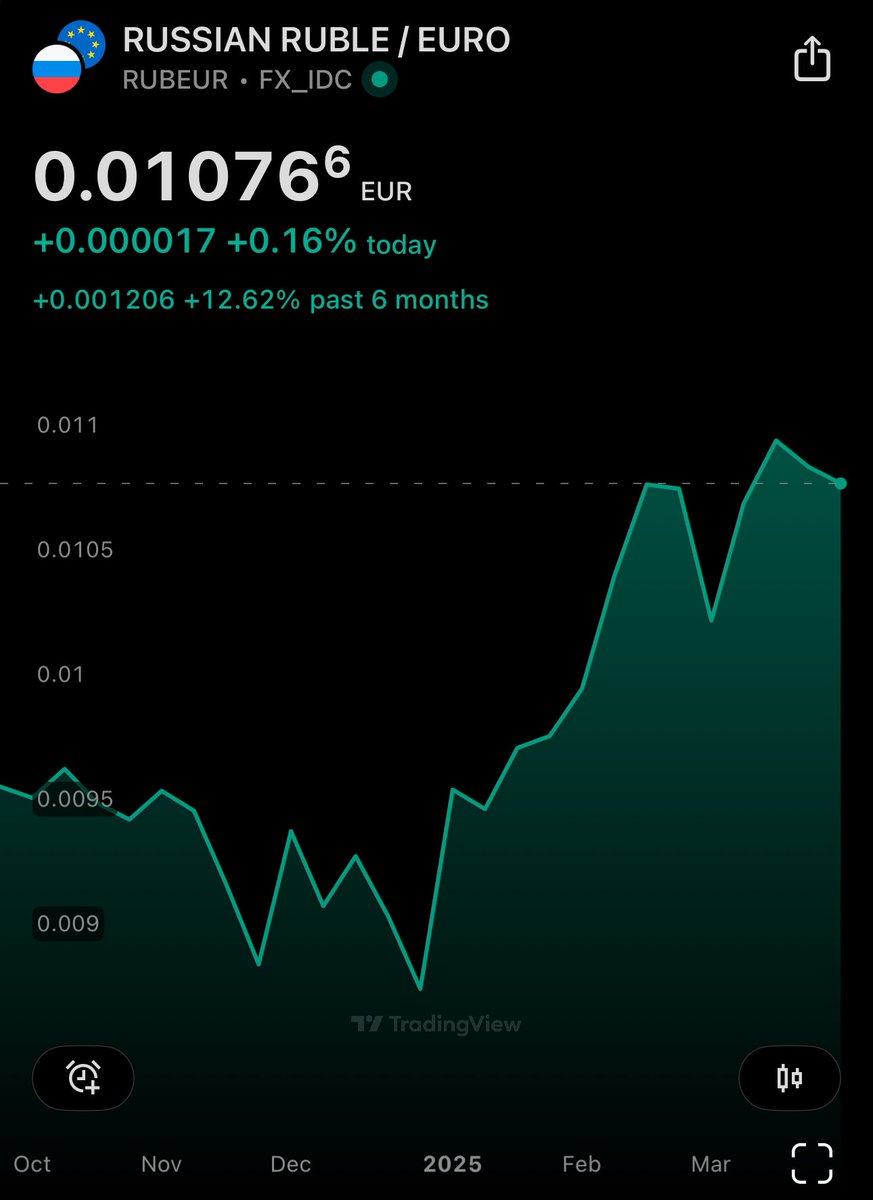
Russian Ruble vs Euro
Past 6 months #RUB up against #EUR by 13%
Ruble is up 34% on Euro since January 2025 (YTD)
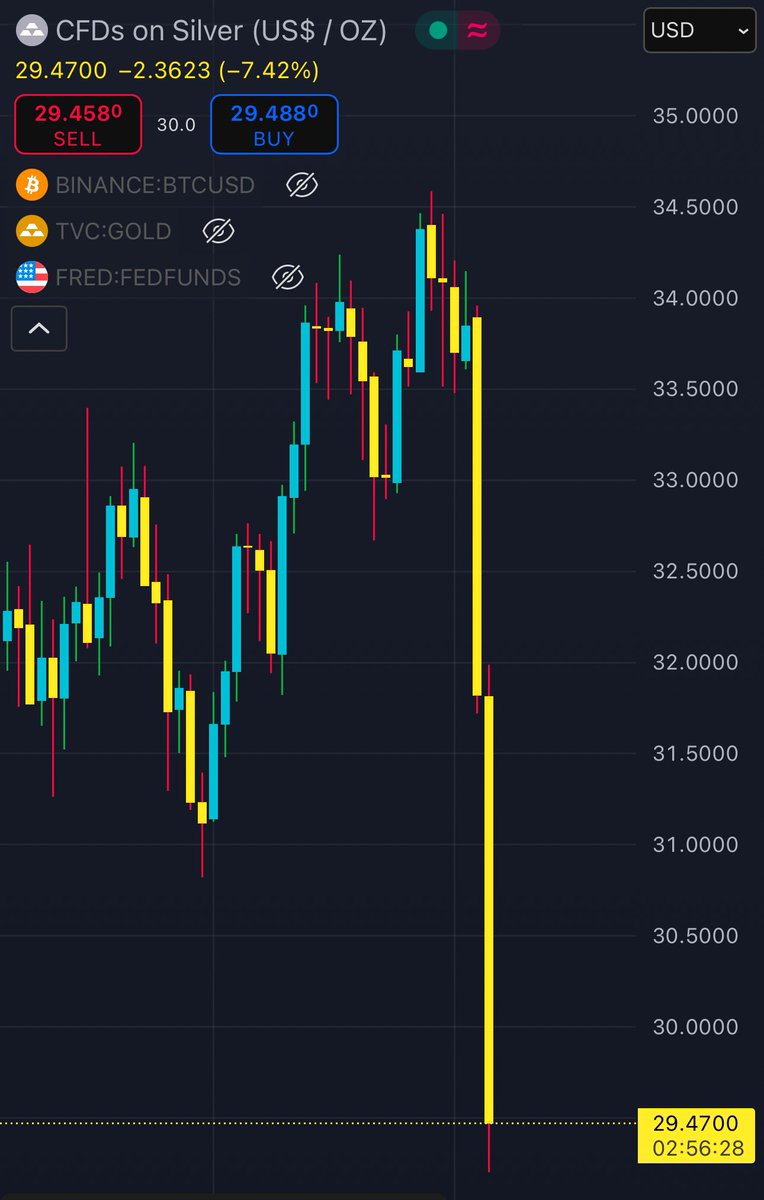
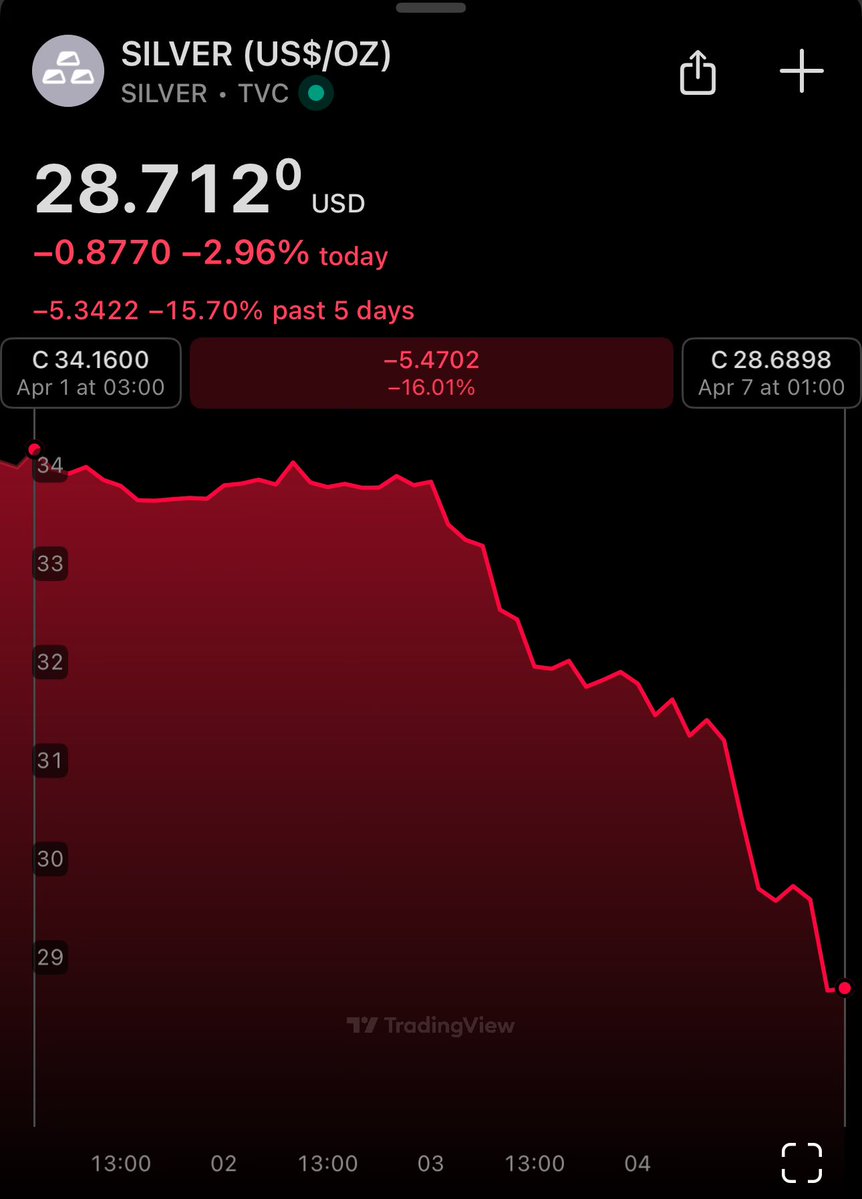
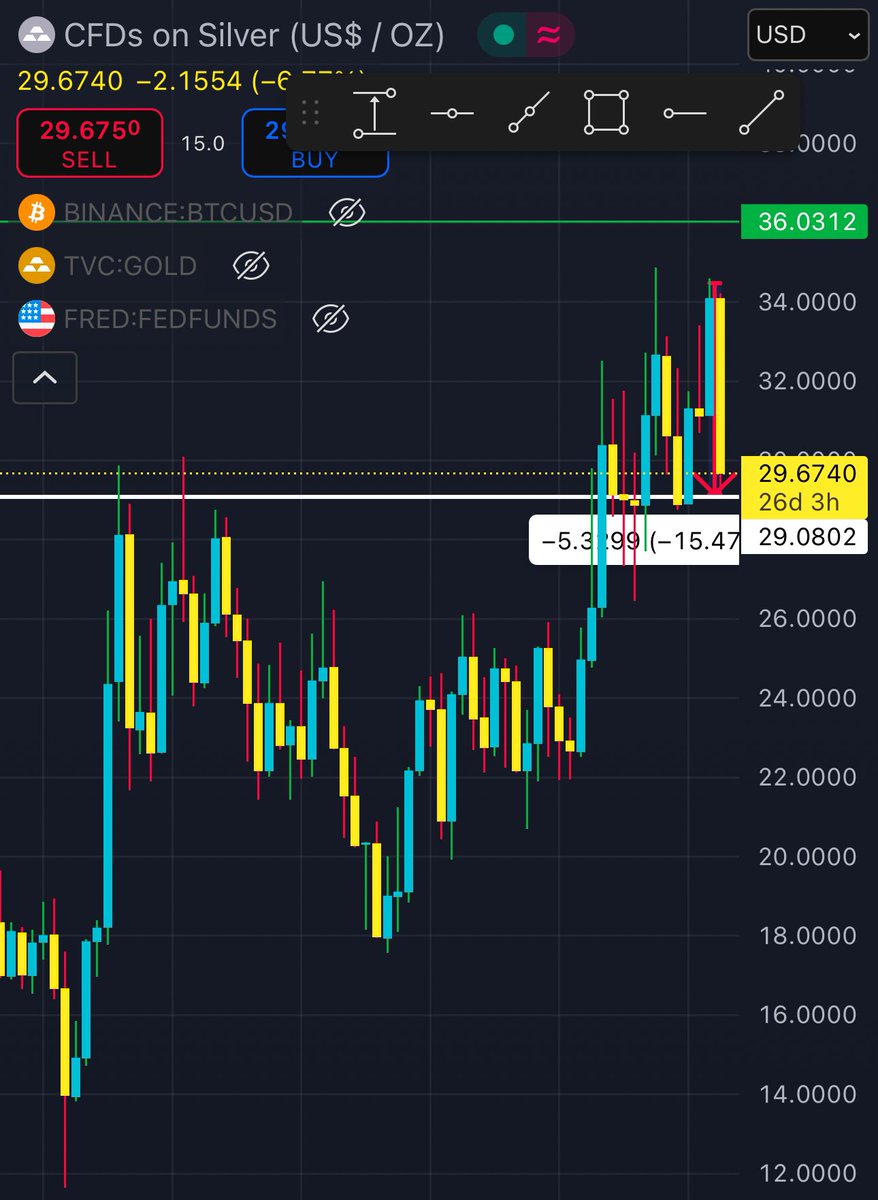
Silver back to August 2020 price
After a tariffs-induced pullback of 15% today, silver is now at start of COVID prices
So much inflation that still isn't priced in
It will recover. And a lot!
🤖 I asked Grok 3 why silver is down today
DeepSearch said that this is likely due to a stronger USD
But #DXY is also down 😂
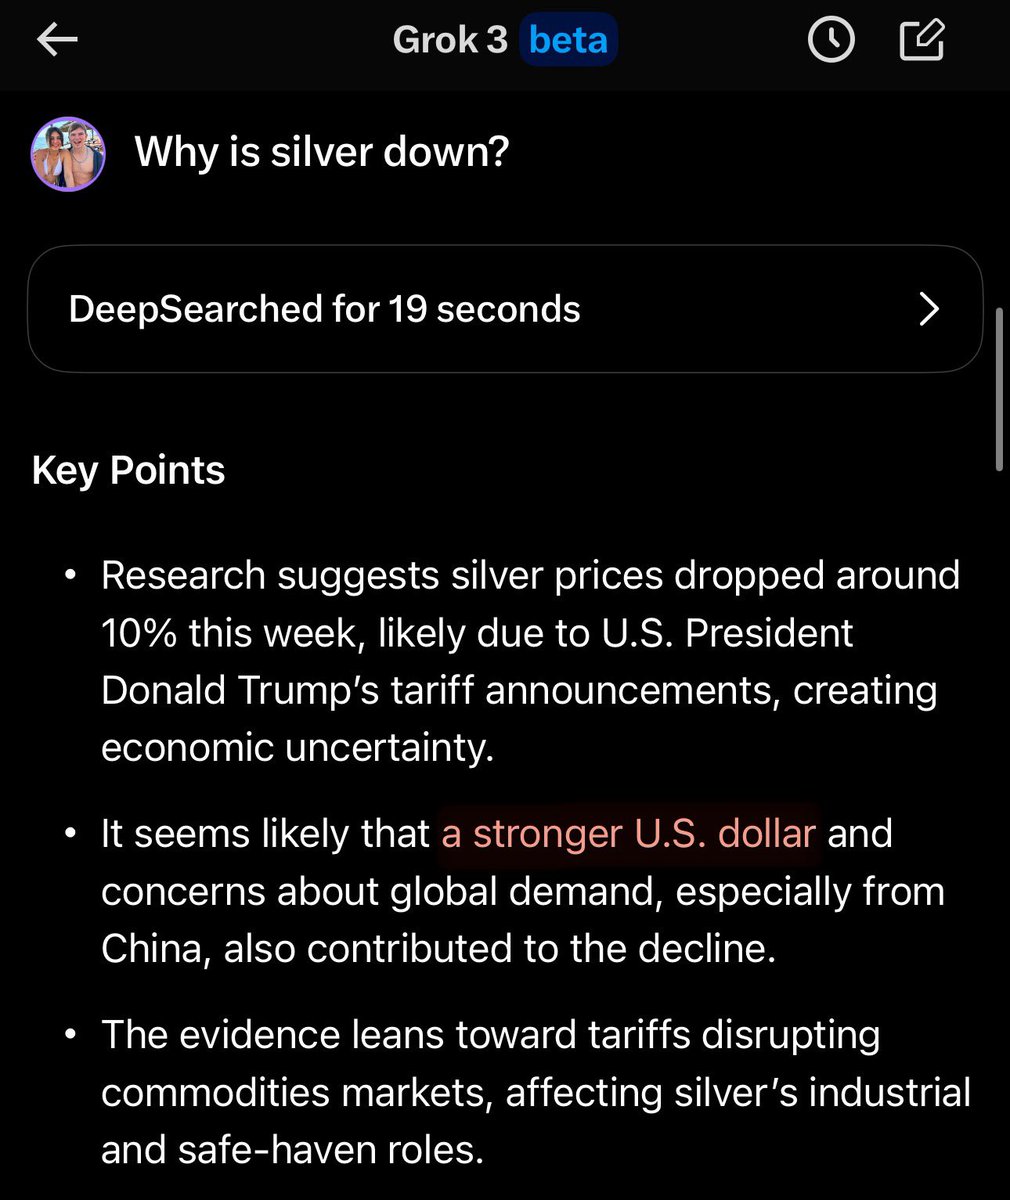
Who's selling silver? 😭
📉 CDFs are down 15% on the day 🤯
I guess it's a tariffs freebie 🤷♀️