Overfitting In Machine Learning Models Visualized
I came across the visualization of 3 functions which demonstrate how a model can become overfit to noise.
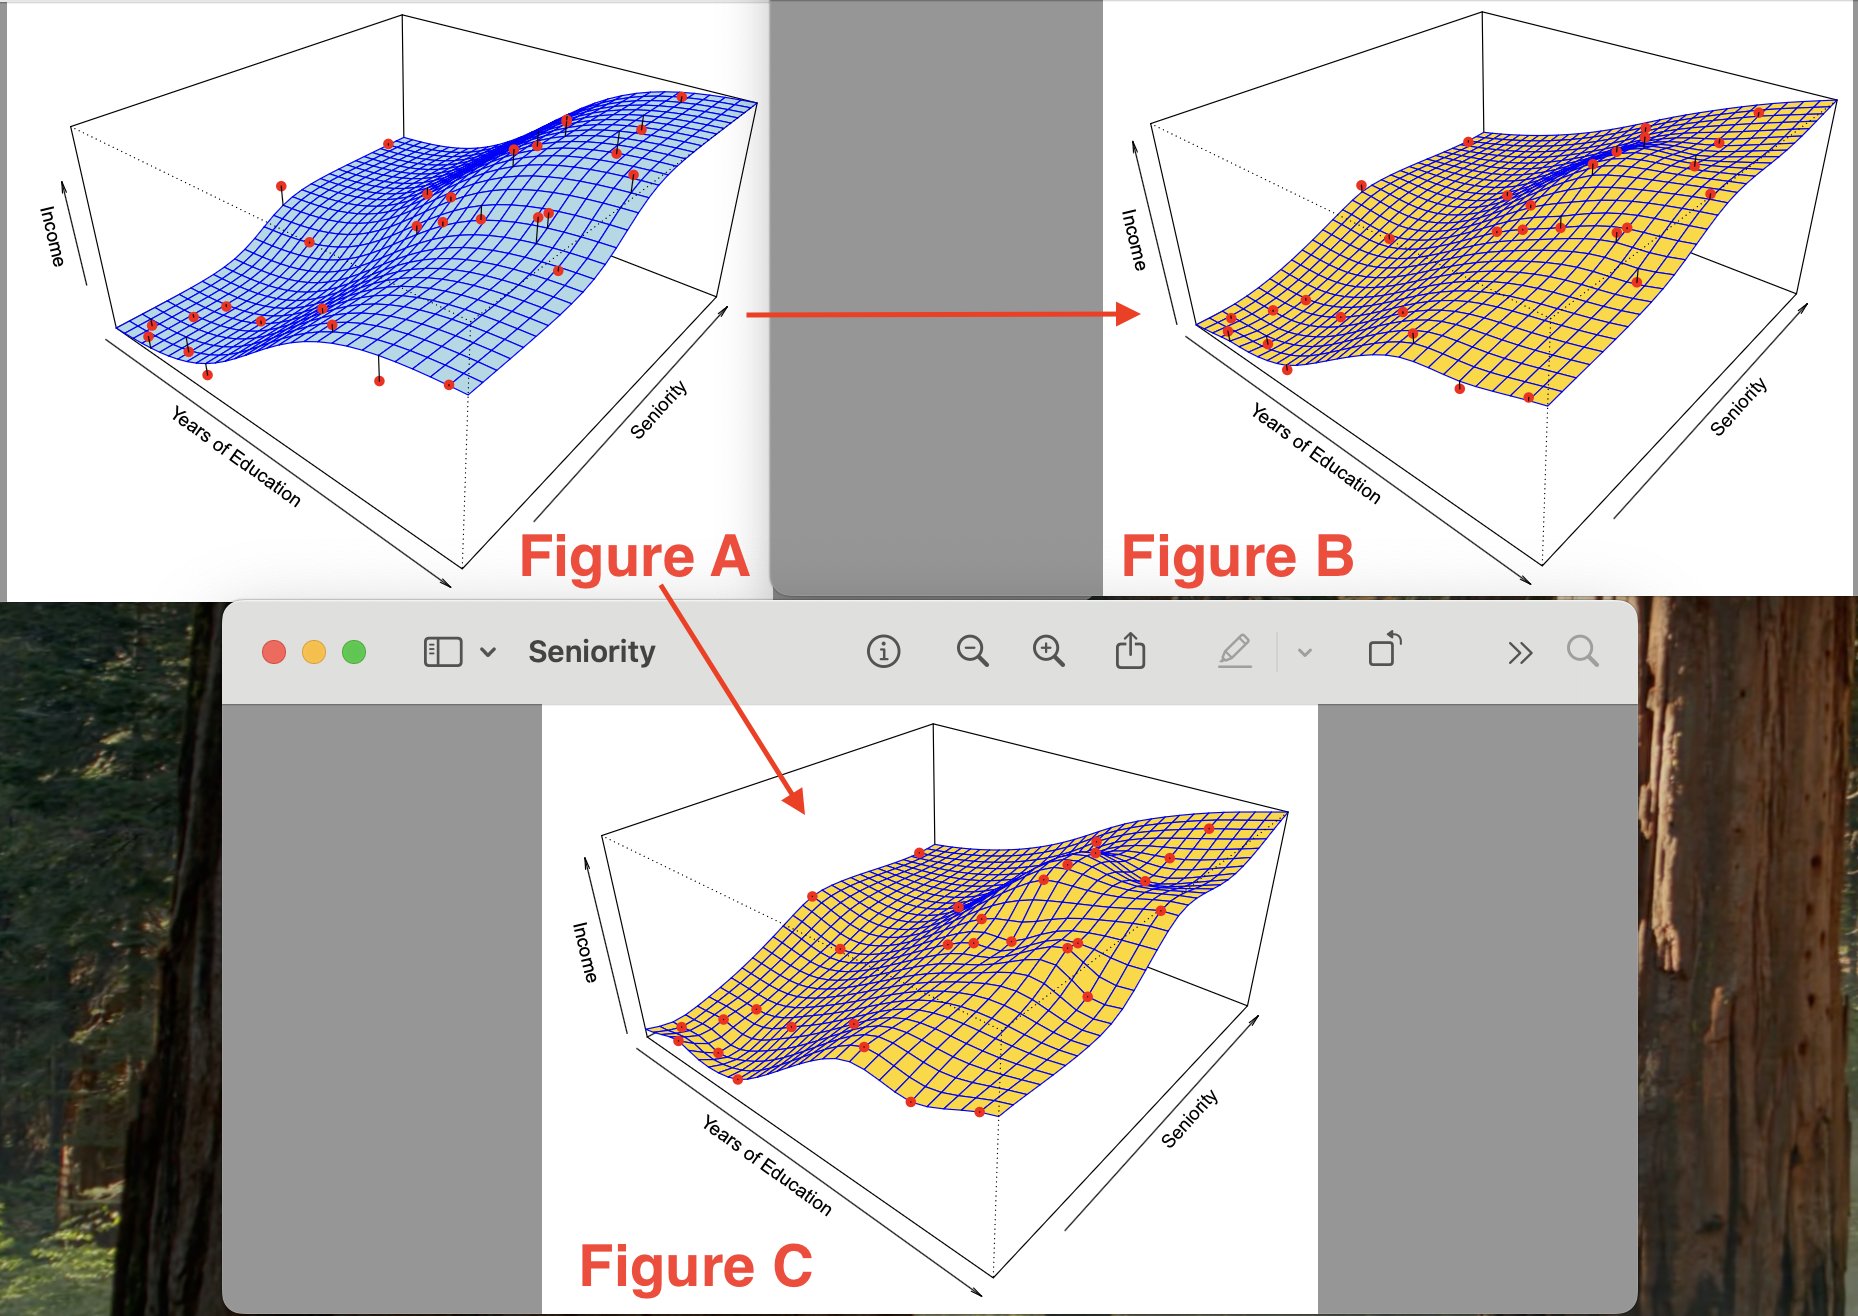
So we are trying to estimate the function whose graph visualization is shown in figure A. In A you see the true underlying function representation. Figures B and C are estimates for the true function shown in Figure A. In Figures B and C, a thin-plate spline fit is used to approximate the function shown in A. To obtain the function/model in Figure C, a smaller level of smoothness was used than in Figure B (less smoothing means more flexibility/effective degrees of freedom).
Figure B approximates the function pretty well, while Figure C fits the training data *perfectly*, with ZERO errors on the training data (in figure C you can see that all of the red points are on the yellow surface). However, you notice that the surface in figure C is a lot more variable/wiggly than in figure A - this is because in the process of constructing the function model in Figure C - we overfit on the noise in the training set!
So by overfitting you are making your model extremely sensitive/adapted to the training data, and the model ends up learning from the noise instead of actual signals. Regarding a machine-learning approach to trading/finance - this is how you get >90% success rate while backtesting your model, but around random performance with novel real-world price data.
You have to remember than beyond trivial use-cases, your models are never going to be perfect — and if they are, you are probably overfitting. You have to remember that any ML model that you construct *NEVER* perfect, due to the presence of irreducible errors, bias and variance.