Global liquidity indicators & flows
Short-form analysis of TGA, RRP, money aggregates, credit growth and cross-border USD flows that drive risk assets.

Going long on Bitcoin now at $68K is very risky (and maybe brave!). I would't do it
There is too much negative pressure on global liquidity, which makes downward price shocks in the near term much more likely
And once again -- global liquidity is not measured by M2, that's only a part of it.
Why High Oil Prices Are Bad For USD (HINT: China & Credit)
I don’t think that higher oil prices will help the value of US dollar medium to long-term this time. Higher oil prices induce higher prices for producers, which lead to higher prices for consumers. The US economy is already extremely dependent on its refinancing capacity. Currently, there are liquidity stress signs across several Fed facilities, which make that refinancing/rolling-over more difficult.
Higher oil prices, means even more new financing to cover the additional costs, which will further increase the country's refinancing burden. So this would push up not only broad & base money, but also raise their "baseline". The "baseline" will increase because the notional USD amount to refinance in the future will increase, meaning higher future liquidity needs.
In the most basic sense, this will increase the domestic supply of USD. If you consider the current slow, but steady decrease of demand for US Treasury debt instruments -- that's reduced demand for USD. Increased supply, combined with a reduced demand, implies a lower price.
The most notable instance of Treasury holding reductions (including not rolling them) is by People's Republic of China -- the world's #1 largest exporter, and China's explicit goal of increasing the share of renminbi in international settlement. Although the first country to successfully move away from USD was Russia -- and they did that by effectively swapping USD-denominated assets for gold and renminbi. If you go back in history, you will find a presidential order from the Russian Federation's president instructing the Central Bank of Russia to increase their gold tonnage holdings back in 2005. Other sovereigns are likely replicate this model, at least in part.
I believe the ECB + NCBs in the EU may also soon move towards the direction of reducing the share of USD-denominated holdings in their balance sheets as well. This situation presents as a great opportunity for increasing share of EUR usage, as it's already the 2nd most used currency, following the USD. Increased bi-lateral trade agreements with China would strengthen both, Euro and renminbi via increased demand -- and there's an intrinsic incentive to do that, as there is a lot of value that can be imported, and is already being imported, from the PRC. This would of course lead to the increase of renminbi-denominated holdings across the central banks in the EU.
Due to the above, the demand for USD is facing a downward pressure, while USD liquidity is showing signs of stress, causing an upward pressure on its supply. Higher domestic prices will only push that supply further up, while leveraging the economy even further (more risk). Sure, higher oil prices means more demand for USD to buy oil in OPEC and higher export revenue, but I don't think that would be sufficient to offset the negative implications.

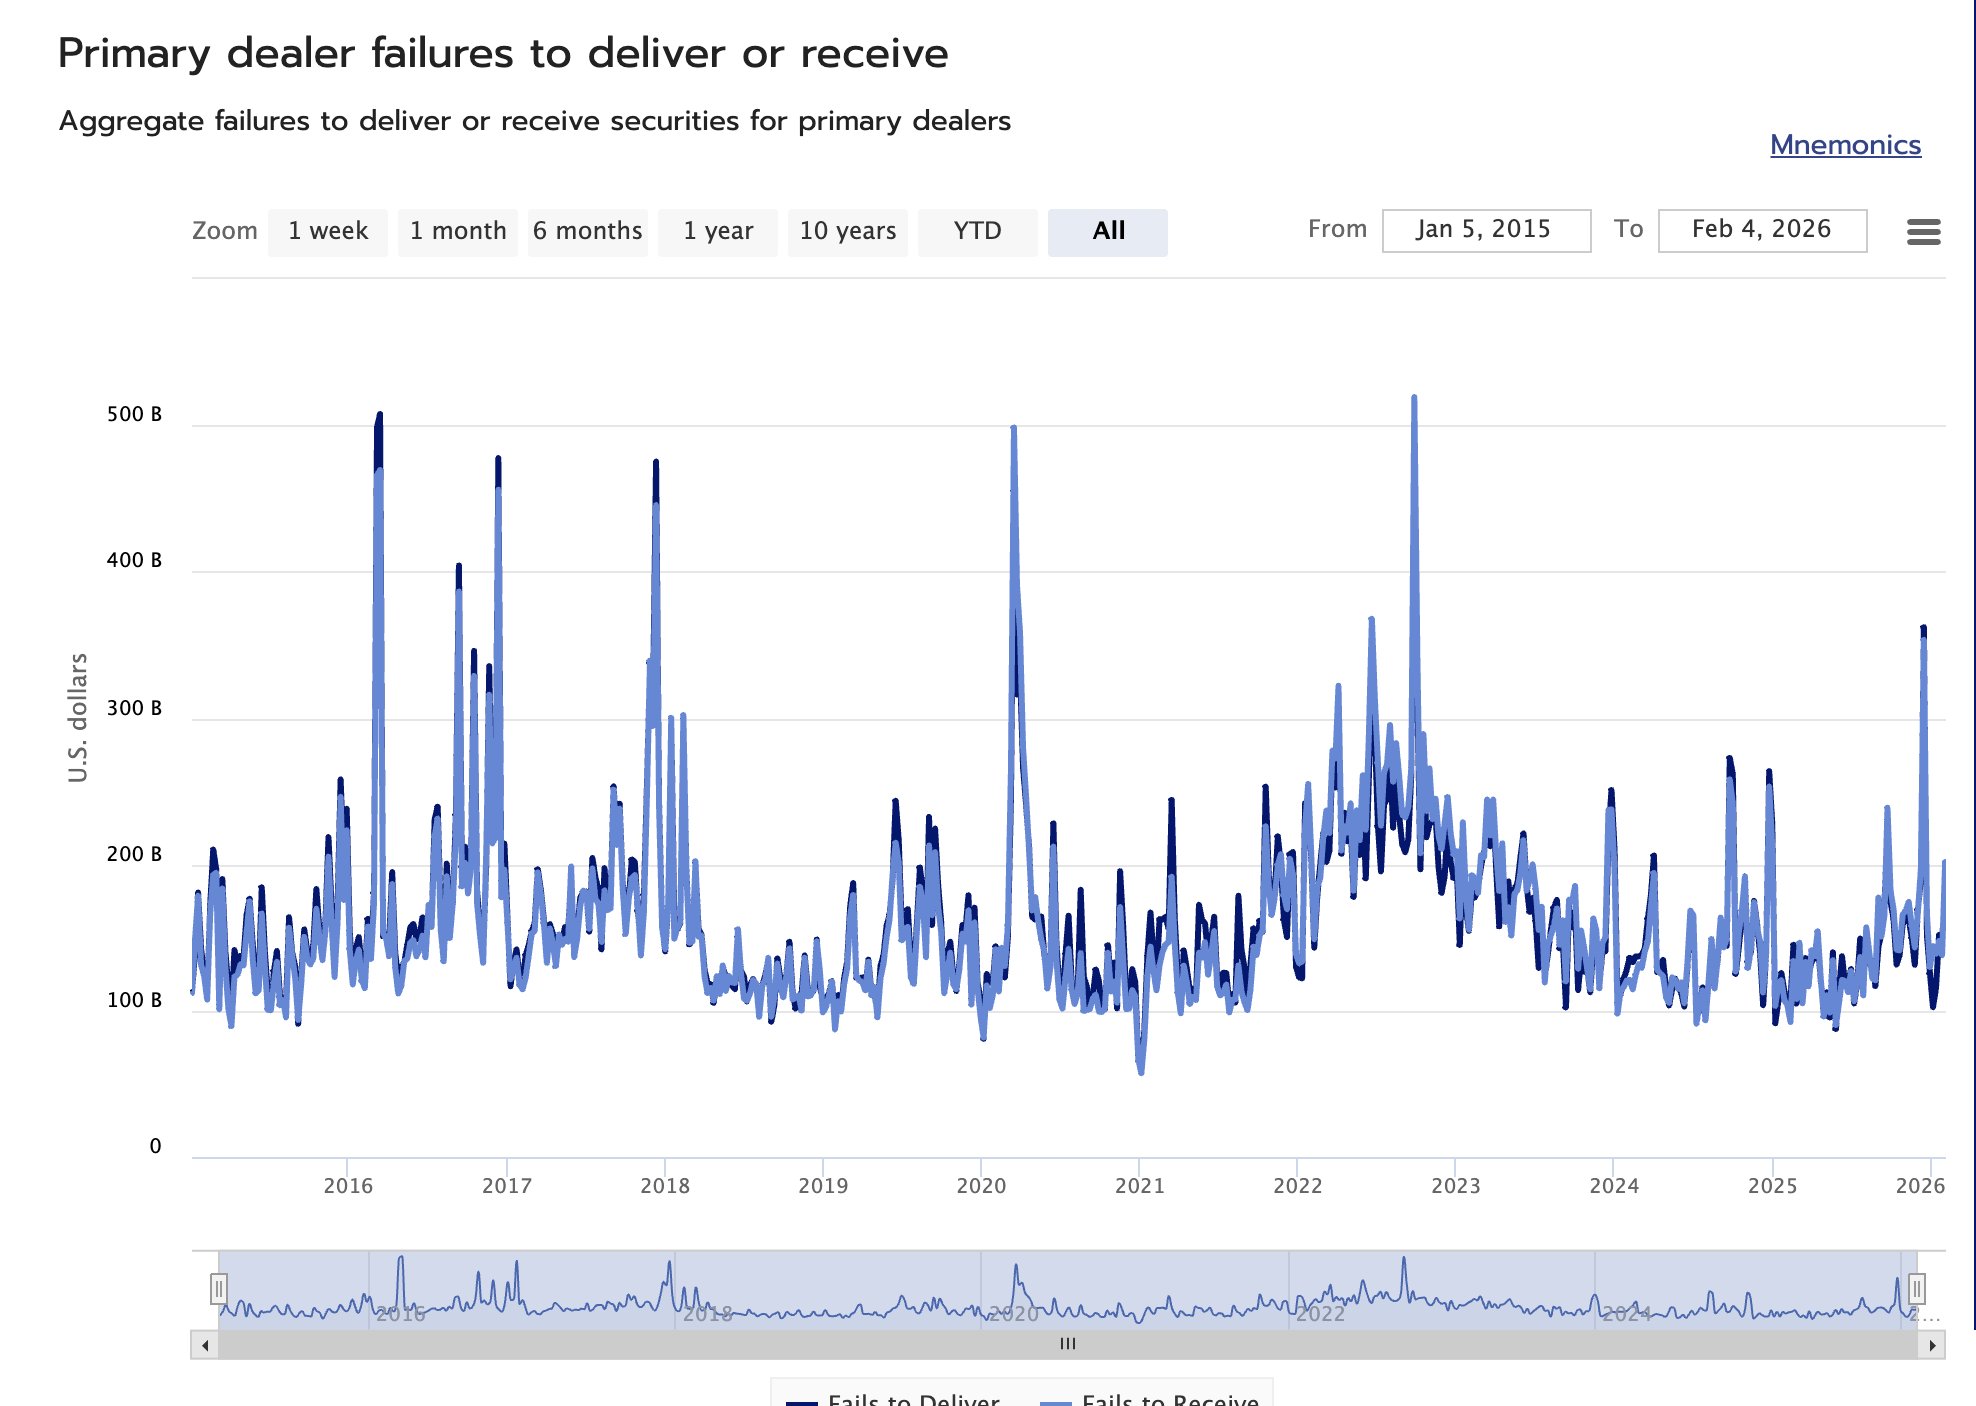
Primary Dealers Failures To Settle Implications For Risk Assets
Security settlement failures on the dealer side are a signal of liquidity stress. In short, it signals that either collateral (securities) or USD liquidity are short. Generally, this is bearish for risk assets.
Dealers exercise a key liquidity role in the financial markets microstructure, so a significant stress on their operations will propagate throughout the market.
You can anecdotally visualize this correlation in Bitcoin by noticing that the peaks of failures to receive/deliver by dealers coincide with at least short-term tops for Bitcoin prices.
This weekly set of data is made freely available by Office of Financial Research (OFR), and you can download it CSV or JSON formats. If you are incorporating this data into your machine-learning trading models, beware of the look-ahead bias, as this OFR data is released with about a week of delay.
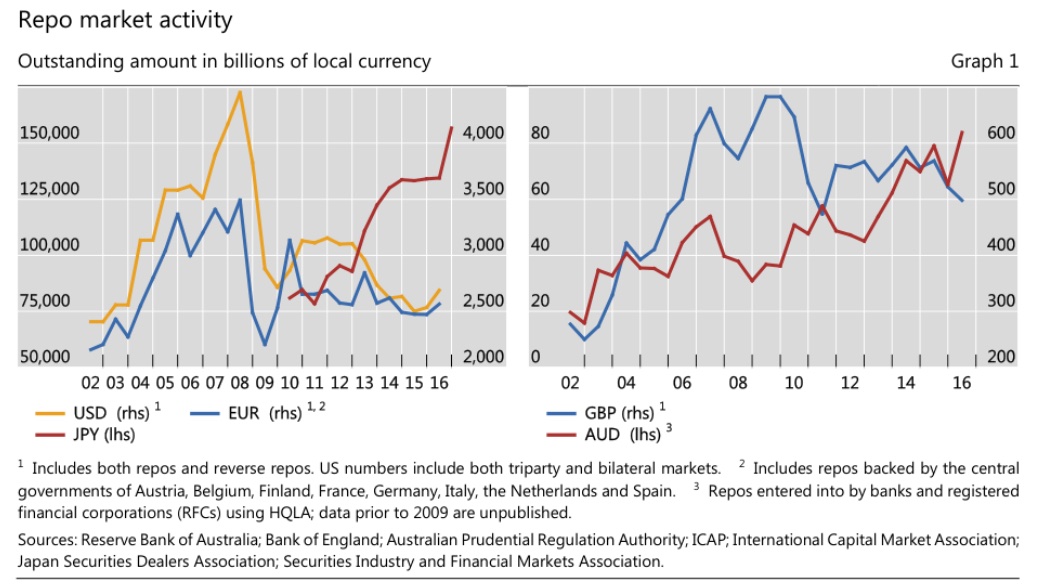
M2 Money Supply Is A Bad Measure of Global Liquidity
If you're using M2/M3 as a measure of global liquidity, you're under accounting for at least half of "global money supply".
Here's some USD-centric data:
➖ U.S. M2 supply: ≈$23T
➖ U.S. Money Market Funds: ≈$8T
➖ U.S. Repo Markets: ≈$13T
These are USD/U.S. focused figures, so they don't account for global liquidity per se (e.g. PBoC's balance sheet is larger than Fed's), but they do show how M2 falls short of being an accurate proxy for the measure of global monetary/currency supply.
I've written several articles on global liquidity and how to measure it. You can read them free of cost in the threads section of my website.
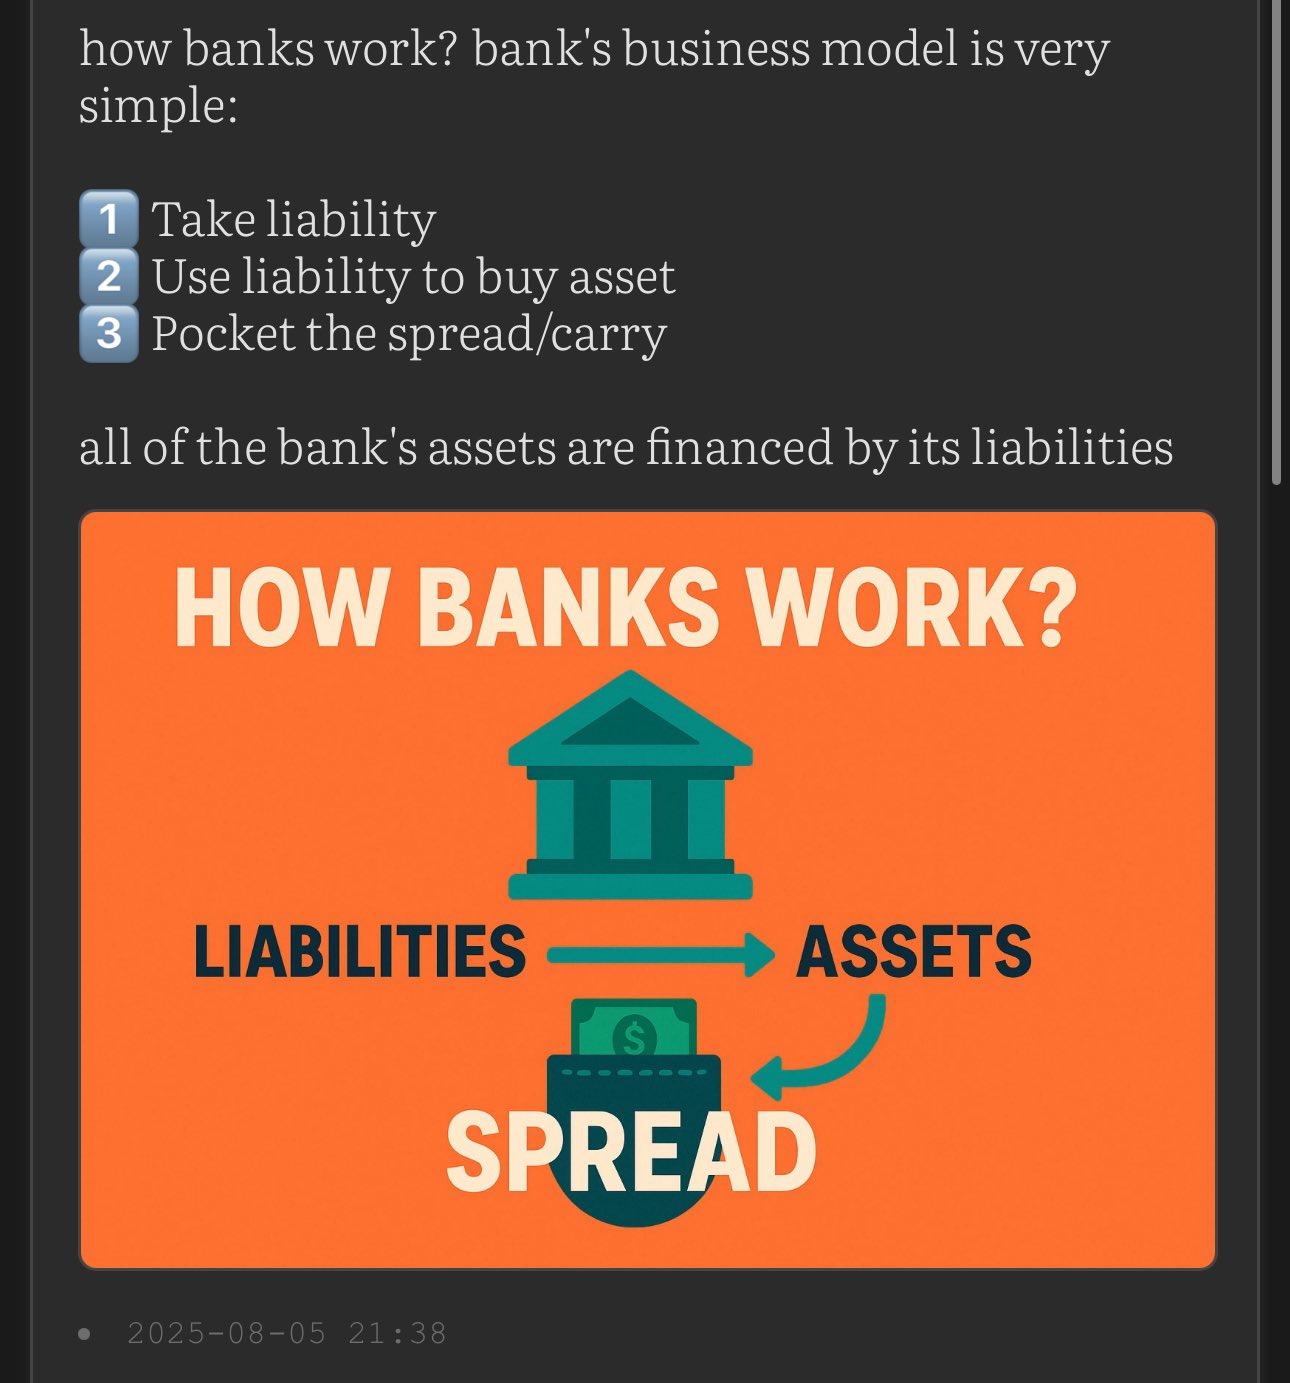
How Banks Create Money When Purchasing Assets
I have previously written about the unique legal powers given to commercial banks and credit institutions in general, that allow them to create new currency, thus increasing its supply. For banks, this also extends to their open market operations, such as when they buy securities and other assets from the open market. If the bank’s counterparty happens to be a non-bank, or more generally an entity without an account at the central bank, then the bank will create new currency to pay for that transaction. I described this in my thread/article titled "when a bank buys an asset from a non-bank it creates broad money":
https://illya.sh/threads/@1755863018-1.html
I received a question about it via e-mail, so I’m writing a follow-up with clarifications.
The flow that I was describing the thread linked above is what happens when a bank buys an asset from a non-bank. Let’s assume the bank ABC wants to buy an asset from you. Let’s forget about US government bonds for now, let’s say the bank wants to buy 100 shares of Tesla from you. The current market price for 1 Tesla share is ≈$450, so the ABC bank would pay you $45000 and you will give the bank the 100 shares. Let’s also assume you have an account in that bank (this is not mandatory!)
Let’s say that right before the bank makes a purchase from you (a microsecond before that transaction/sale happens) there is a total of $1 million ($1000000) of US dollars in circulation. The moment right after the transaction is made, and the bank crediting your account with $45000, the total money in circulation would become $1 000 000 + $45000 = $1 045 000. The main point here is that those $45000 didn’t exist in circulation before. They were not taken from someone else’s account, nor from internal bank reserves. Those $45000 were created “out of thin air”, and that money was credited into your account. I say “credited” because it’s from the point of view of the bank - your deposit account at the bank is a liability to the bank - it sits on the liabilities side of the balance sheet - a credit increases liabilities.
Now, I referred to “money in circulation”, but I actually meant Broad Money. There is another form of money - called Broad Money. There is a great paper from the Bank of England that describes them, alongside how commercial banks create money: https://www.bankofengland.co.uk/-/media/boe/files/quarterly-bulletin/2014/money-creation-in-the-modern-economy.pdf . But in short, Broad Money is the money available for use by the larger economy (individuals, companies, etc), while Base Money is physical currency and currency held in reserve accounts at the central bank - the reserve accounts portion doesn’t touch the broader economy directly.
If instead a bank ABC purchases an asset from another bank DEF - then the total money does not change. The bank ABC would just debit their reserve account at the central bank and credit the reserve account of the bank DEF. So money moves accounts, but total quantity does not change.
In the same manner, when a commercial bank buys bonds directly from the government, there is no creation of “new money” - the money moves within the central bank’s reserve accounts. The general rule is: if the transacting entities have reserve accounts in the central bank the transaction is made within the central bank’s reserve accounts. Commercial banks, governments and sometimes select financial institutions (like in the US) have reserve accounts at the central bank, so transactions within them move Base Money
The following article on how commercial banks work will be very helpful to understand how they operate and create money: https://illya.sh/threads/@1754426330-1
my article on repo rates and BTC price was referenced on bitcoin.com
apparently it's been there for a month, but i only noticed now
it's a short read - and explains the negative price pressure that quarter-ends, and especially September bring on the price of liquidity sensitive assets like Bitcoin
it give you a concrete perspective on the current cryptocurrency price dump, even with decreasing funding rates
lower interest rates means less attractive repo and deposit rates, thus expect more capital movement into assets, as the yields on MMF/deposits become less attractive
overall positive pressure on asset prices
for the next 3 years - gold, silver and real estate (real estate is more region specific) are great assets to hold
i'd be wary of US equities
while it's not the top yet and they'll still move higher - you need to be on the lookout the cycle top, which will manifest in some form in the medium long-term
in the next two years it's reasonable to expect a significant downturn in US equities, which may or may not be longer-lasting. it largely depends on the specific QE & other government policies taken to modulate liquidity and yields
so if you're heavily exposed to US equities, it's a good idea to monitor it closely, as there's a risk of a significant downturn
the biggest downside risk to US equities comes from FX, namely from the value and dominance of the US dollar:
➖ while a weaker USD is positive for cross-border USD credit/liquidity, it also makes imports more expensive for the US - and US is a net importer. increased import prices will put negative pressure on the whole economy, including publicly-traded companies
➖ less dominance/demand of USD will not only lead to less total USD abroad available to invest into the US equities, but also lead to the further development of non-USD financial markets because the capital that moves away from USD will need to get invested somewhere. China is the most obvious candidate to benefit from these developments, especially when it comes to equities and renminbi demand. i believe the EU is in a unique position to attract a lot of that USD-exiling demand, but that would require opening-up the markets and regulatory adaptations in that direction
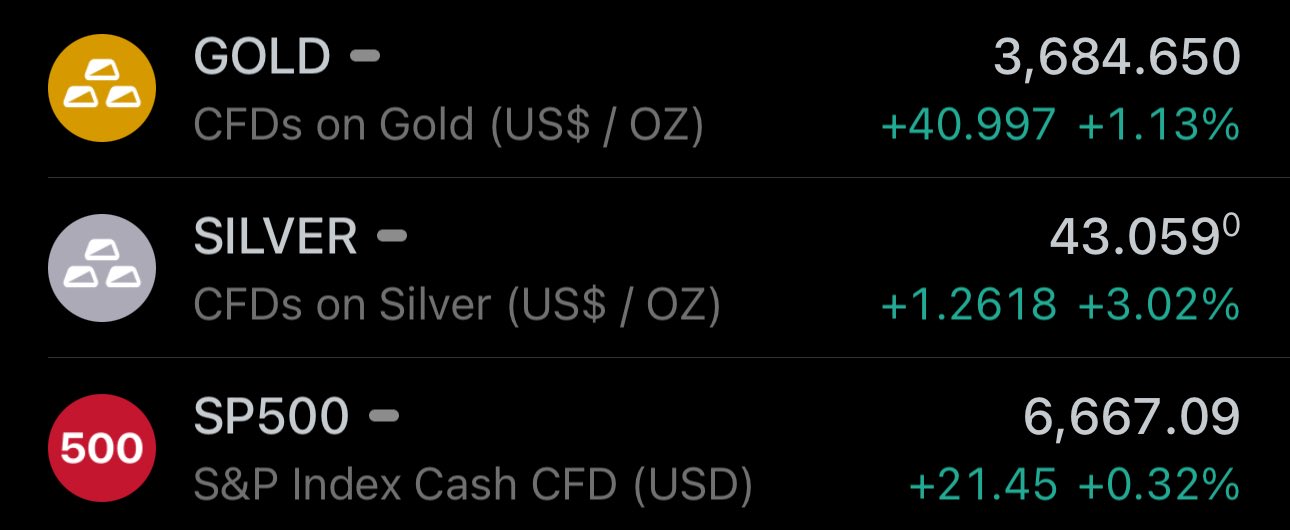
the market reacted exactly as I anticipated in a prior post
a lower median in the FOMC dot plot indeed pushed asset prices up. and you had plenty of time after the Fed's dot plot was published to enter into that leg
look at gold, silver and S&P500 😄
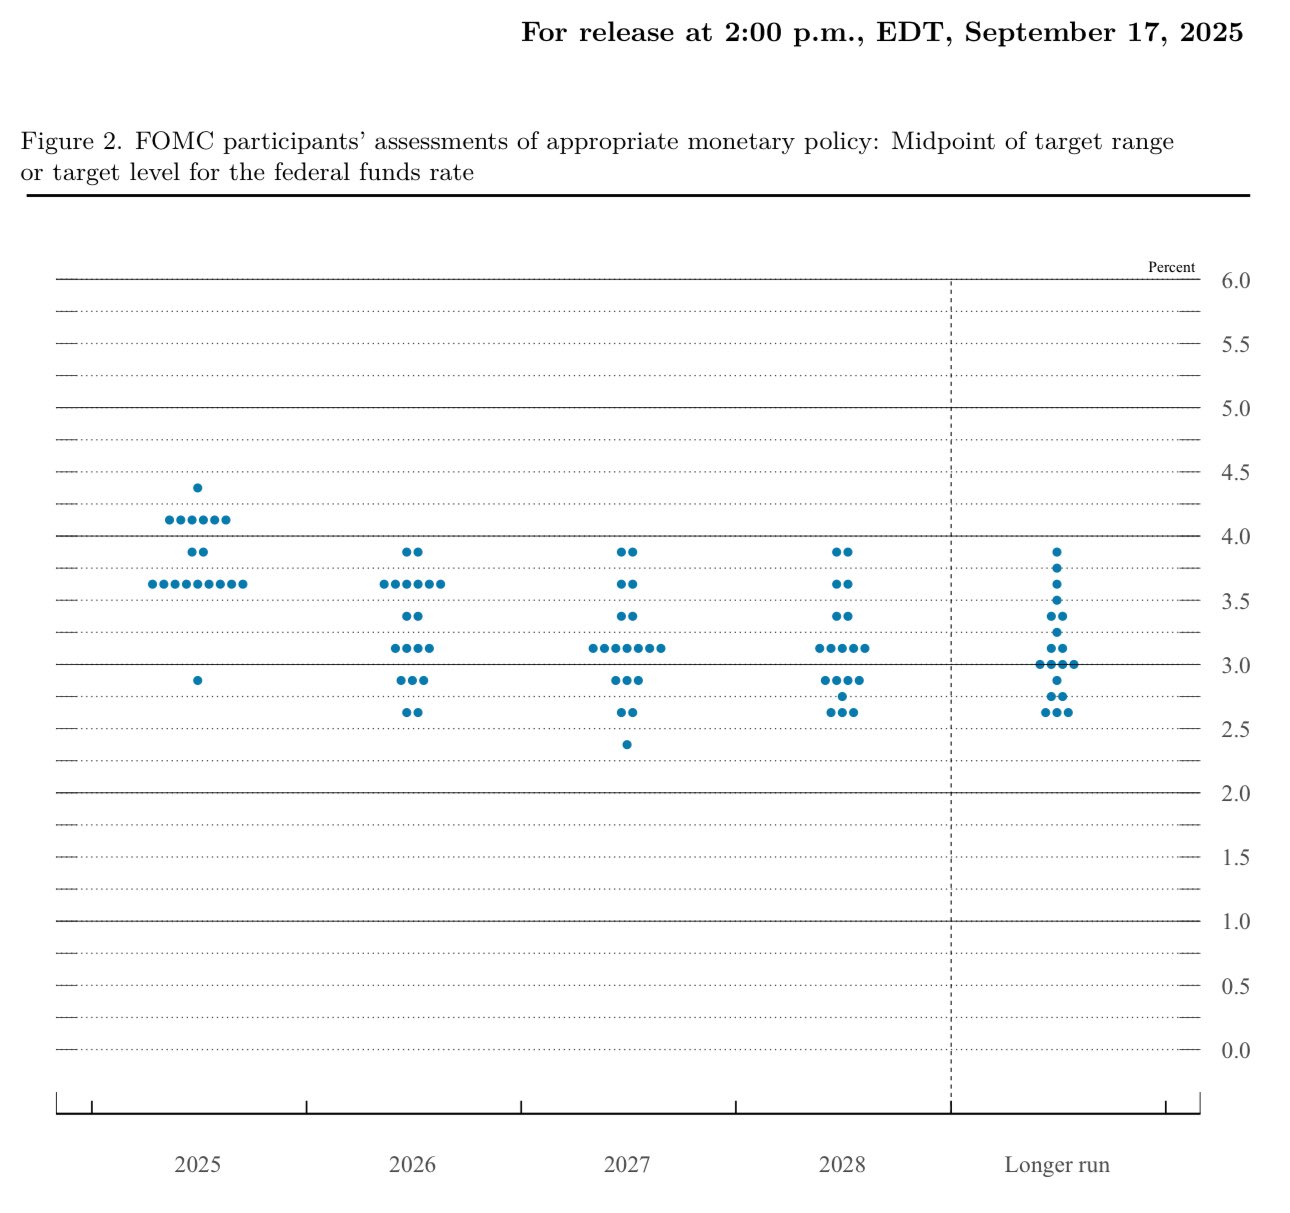
September 2025 FOMC dot plot suggests lower rates than in June 2025
the new implied median for end of 2025 is ≈3.6%, which is lower than the ≈3.9% June figure
this means you should expect the Fed to cut another 50 bps/0.5% in the next 3 months - likely in two 25bps iterations
so as a takeaway: expect volatility within the mortgage rates in the US
➖ upwards pressure: financial downturns in other sectors, organic de-leveraging
➖ downwards pressure: QE, Fed facilities, government policies
the US mortgage bubble will likely pop alongside other bubbles, due to a high degree of interdependence and correlation within the financial sector
the mortgage bubble can both, trigger and be triggered by burst of other bubbles
so you'll see a cross-border systemic downturn
leverage and the carry trades eventually unwind
at some point there isn't enough on-demand liquidity and mass defaults, losses and insolvency occur
this is when the cycle tops/bubble pops
the financial system is heavily dependent on refinancing
this is true for both, governments and the public sector - especially the financial institutions
≈70% of all new credit is used for refinancing/repaying of existing maturing debt rather than novel financing
the financial system infrastructure, including monetary policies of the central banks are correlated
they're heavily exposed to the same set of assets - a lot of which are USD-denominated
this is of course extremely pro-cyclical
gold is a great asset to hold for the next 5 years
it's a hedge against the credit & refinancing bubble of the US equity markets + government debt
but not only against USD - all FIAT & risk assets including crypto
so assuming no sanitization - an initial reduction of liquidity may occur
while the haircut may also fall (upward pressure on liquidity), the volume reduction (downward pressure on liquidity) is likely to have more weight, due to global refinancing/liquidity needs
while the haircut may also fall (upward pressure on liquidity), the volume reduction (downward pressure on liquidity) is likely to have more weight, due to global refinancing/liquidity needs
so if the US Treasury revaluated gold and used all those proceeds to repurchase/retire debt it will likely have an initial negative effect on the liquidity, due to contraction in safe collateral
so if the US Treasury revaluated gold and used all those proceeds to repurchase/retire debt it will likely have an initial negative effect on the liquidity, due to contraction in safe collateral
NCCBR participants are generally subject to regulations and balance sheet constraints - so don't think that null/negative haircuts means the collateral can be rehypothecated infinitely
these bilateral arrangements is where financial institutions manage their liquidity needs
thus, a 30 year Treasury bond trading at par (i.e. market value = face value = $1000) can create up to $50K of new liquidity/credit!
you cannot leverage as much with reserve money. so a $1000 bond can create more liquidity than $1000 cash/reserves
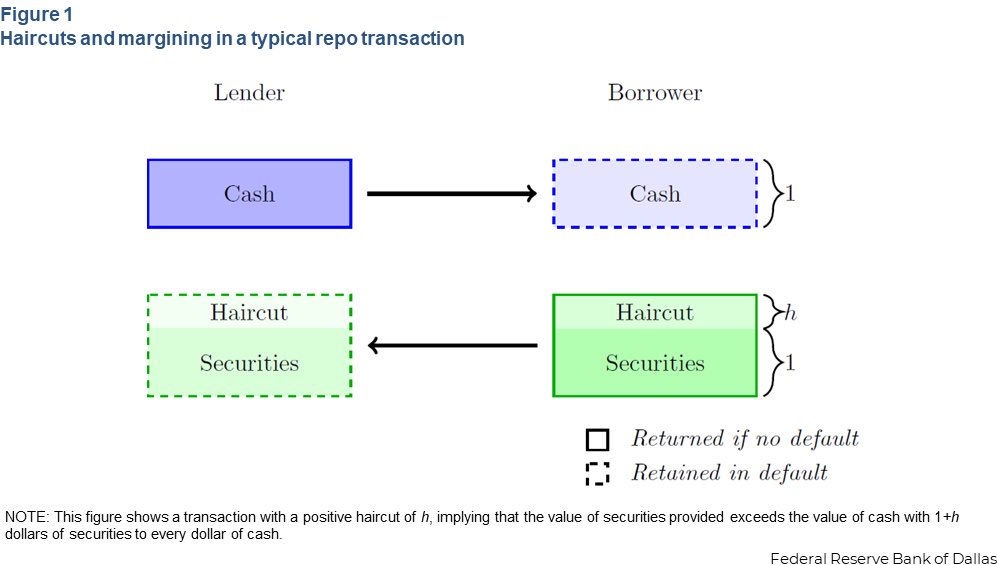
maximum liquidity added by bond = market value/haircut
so a Treasury security worth $1000 with a haircut of 2%, can create up to $50000 in new credit/liquidity
computed using the formula above: 1000/0.02=50000
maximum liquidity added by bond = market value/haircut
so a Treasury security worth $1000 with a haircut of 2%, can create up to $50000 in new credit/liquidity
computed using the formula above: 1000/0.02=50000
to estimate the maximum liquidity that can be added by a bond divide the market value by its haircut (e.g. effective repo haircut on that bond)
to estimate the maximum liquidity that can be added by a bond divide the market value by its haircut (e.g. effective repo haircut on that bond)
collateral gets reused/rehypothecated, reserves don't
dealers re-pledge/re-use Treasuries, e.g. through repo and reverse repo. thus, the financing capacity of Treasury bills, notes and bonds exceeds their market value
retiring debt with gold revaluation would change the composition of liquidity:
➖ less US government bonds (safe collateral)
➕ more base money (reserves) and/or broad money (deposits)
so the end result is more base and/or broad money, but less prime/repo-eligible collateral
persistent deficits & refinancing needs will add $1 trillion of new debt in less than a year
so gold revaluation is insignificant for US federal government's debt problem
the funding could also come from Fed’s facilities, like the SRF or OMO
however, current SRF rate is 4.5%, which is above the yield on T-bills, and Fed is still officially in QT, so no large-scale, longer-term liquidity injections via open market operations
moreover, currently the US Treasury is issuing debt and cash at ON RRP is running low. MMF, dealers and banks purchase those T-bills. if they do not have cash in ON RRP, it will be financed by outflows from bank reserve accounts into TGA
moreover, currently the US Treasury is issuing debt and cash at ON RRP is running low. MMF, dealers and banks purchase those T-bills. if they do not have cash in ON RRP, it will be financed by outflows from bank reserve accounts into TGA
this is one of the reasons why September is historically a bad month for Bitcoin
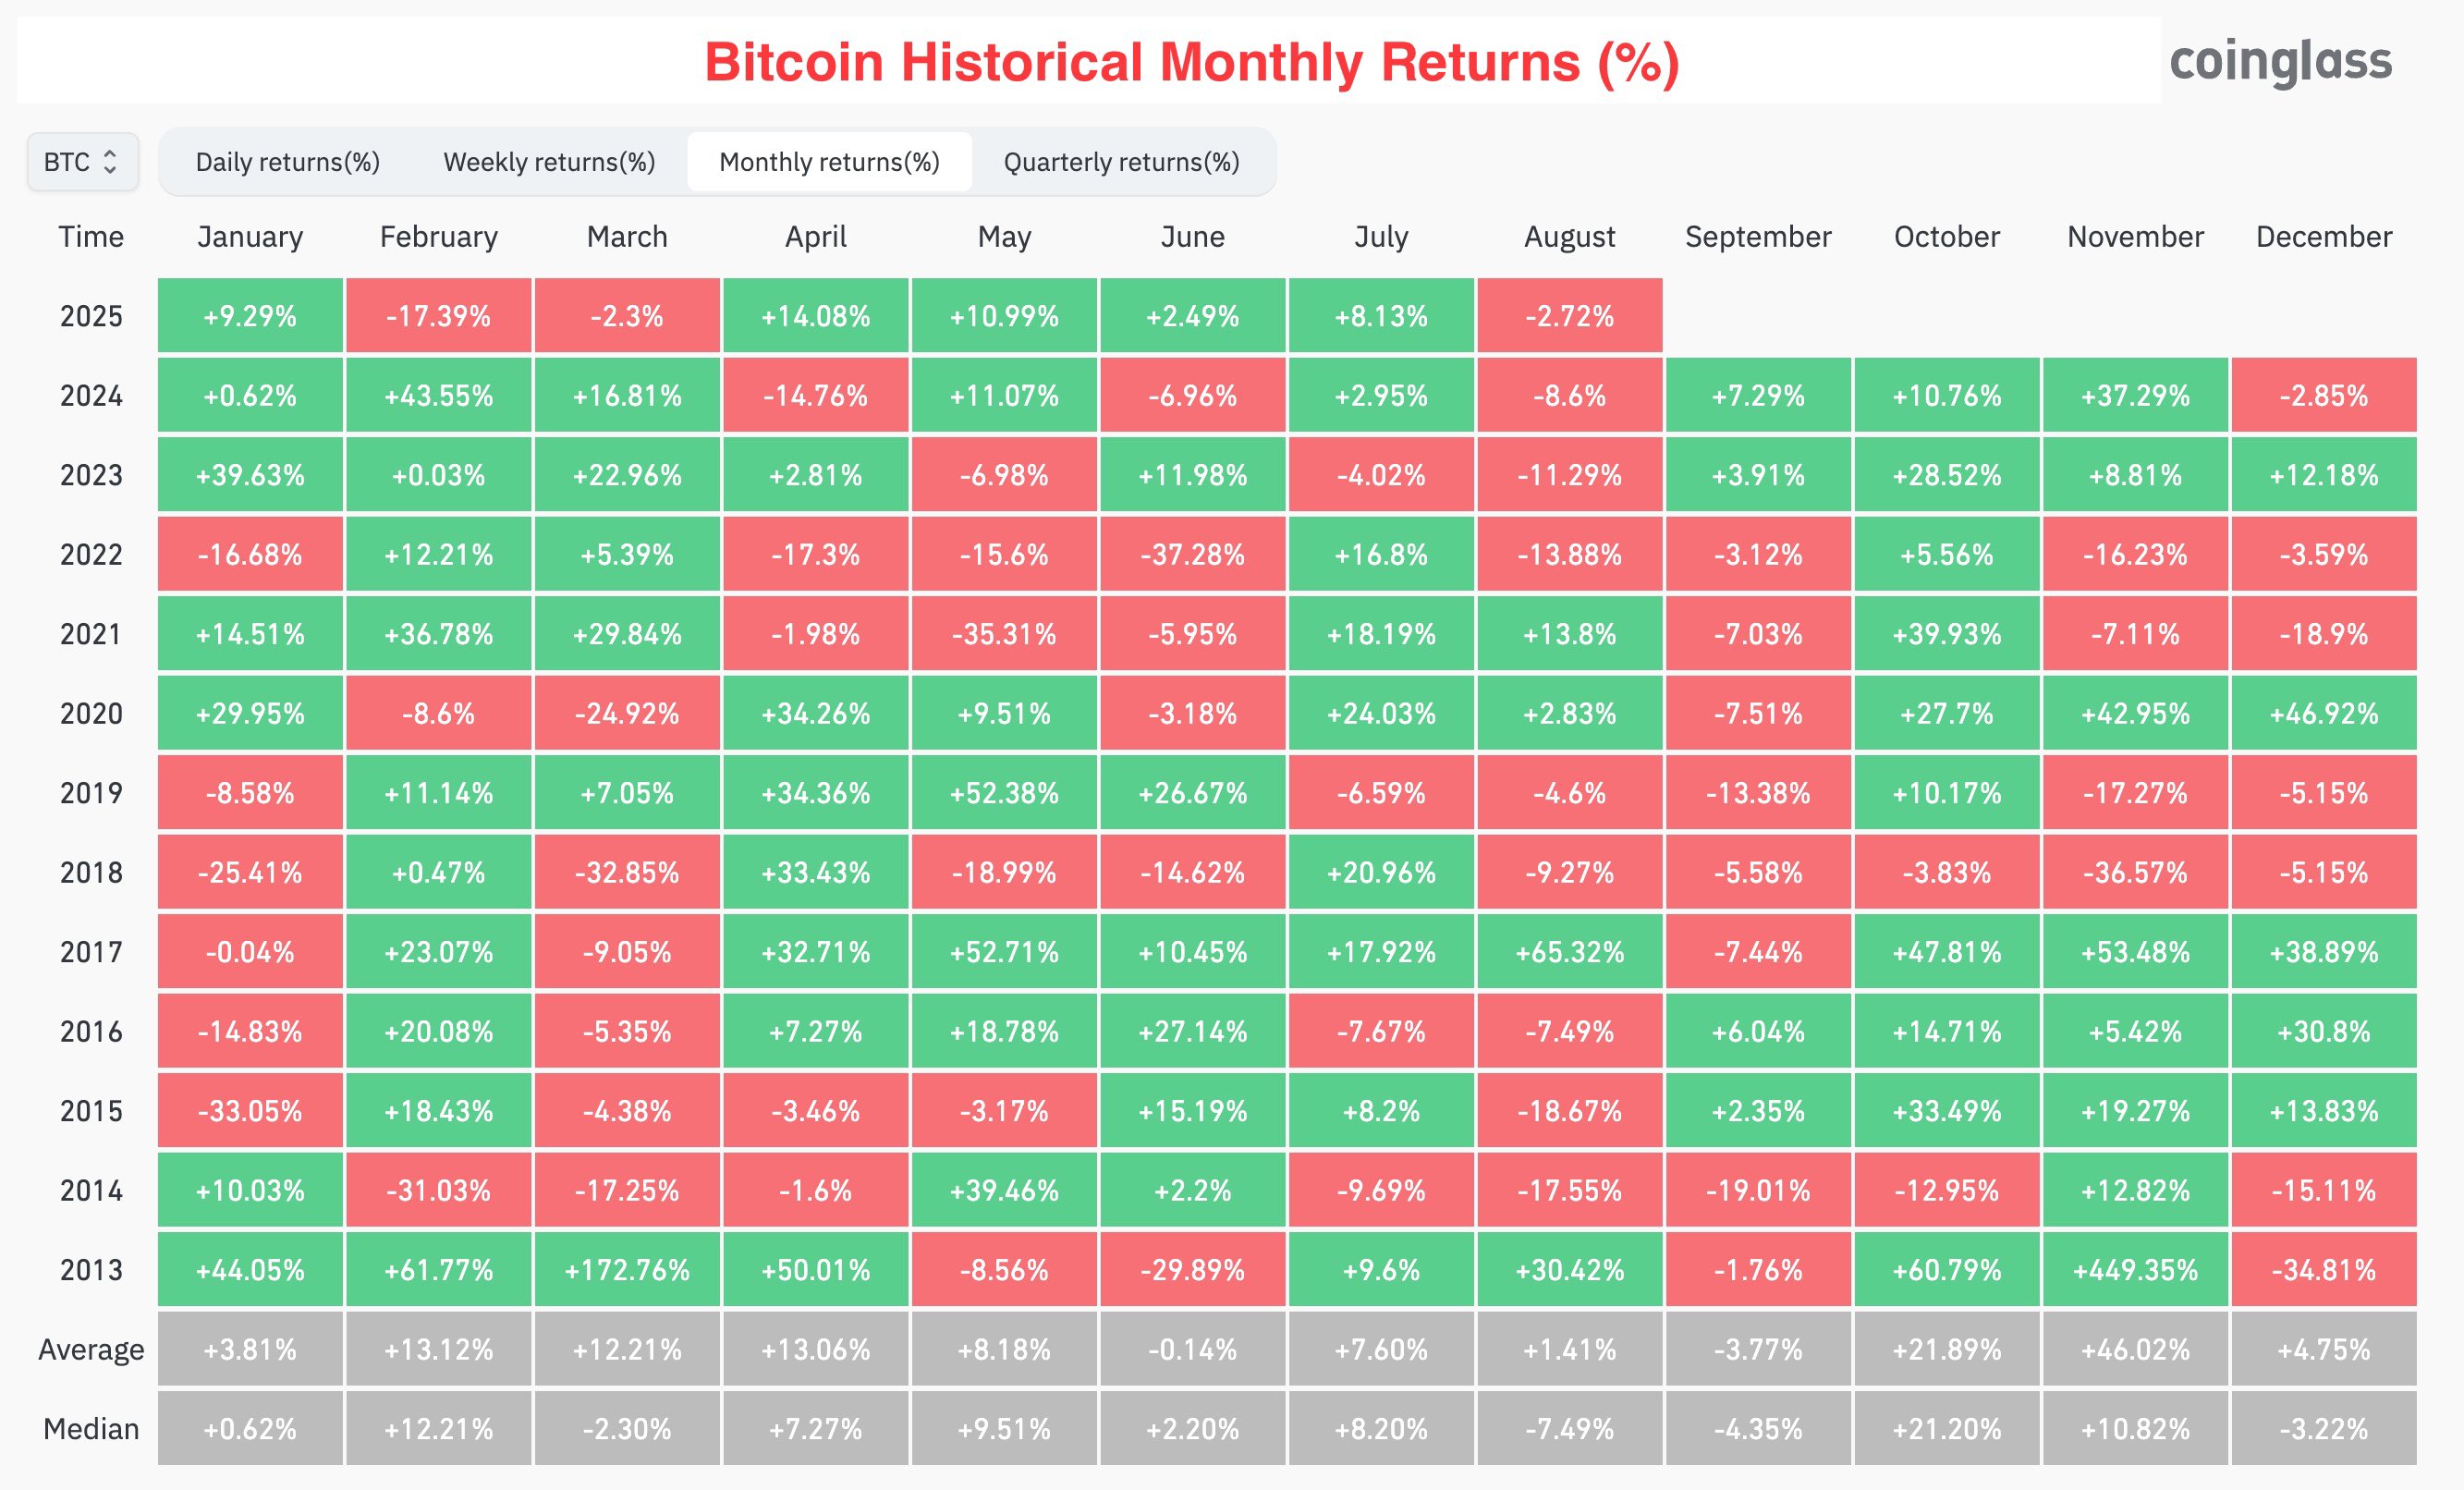
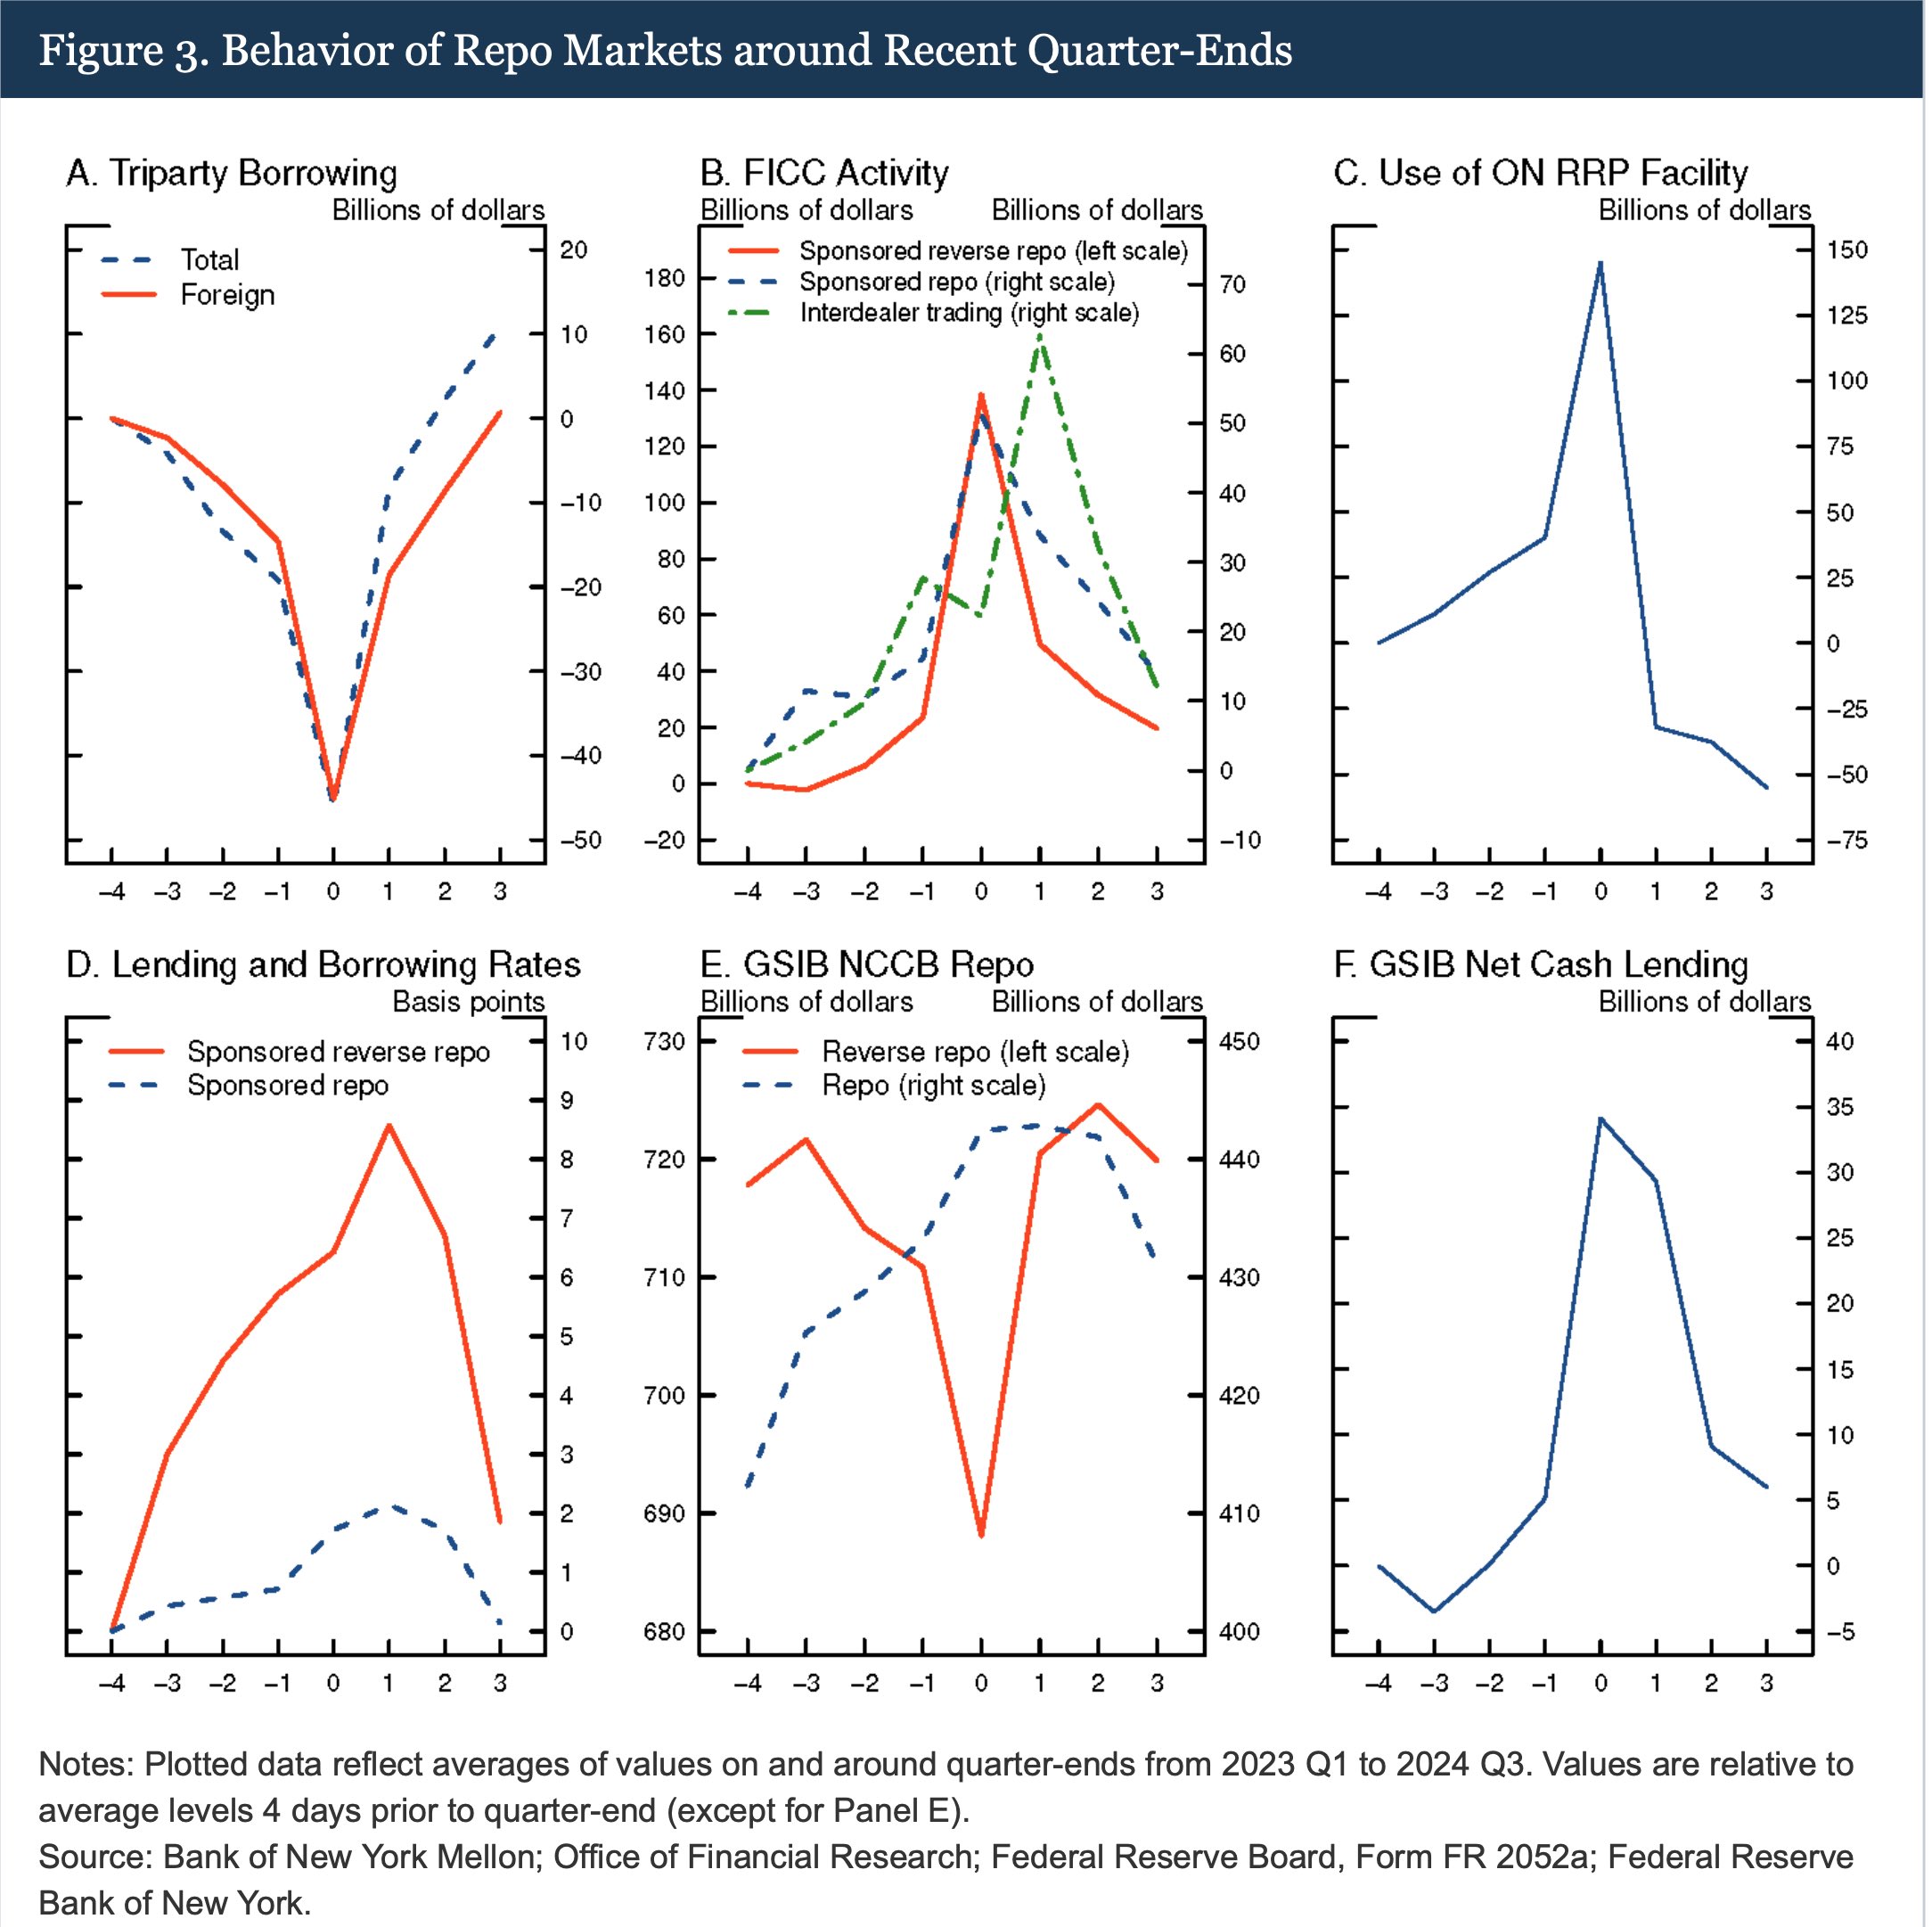
repo rates increase and borrowing decreases in quarter-ends
this includes the upcoming month of September. in addition, September 15th the corporate tax limit in the US
this reduces global liquidity, so asset prices tend to fall
when banks buy assets from other banks - new deposits do not get created, as the payment happens by moving funds between the commercial bank's reserve accounts at the central bank
thus, it's base money movements/reallocation, not creation
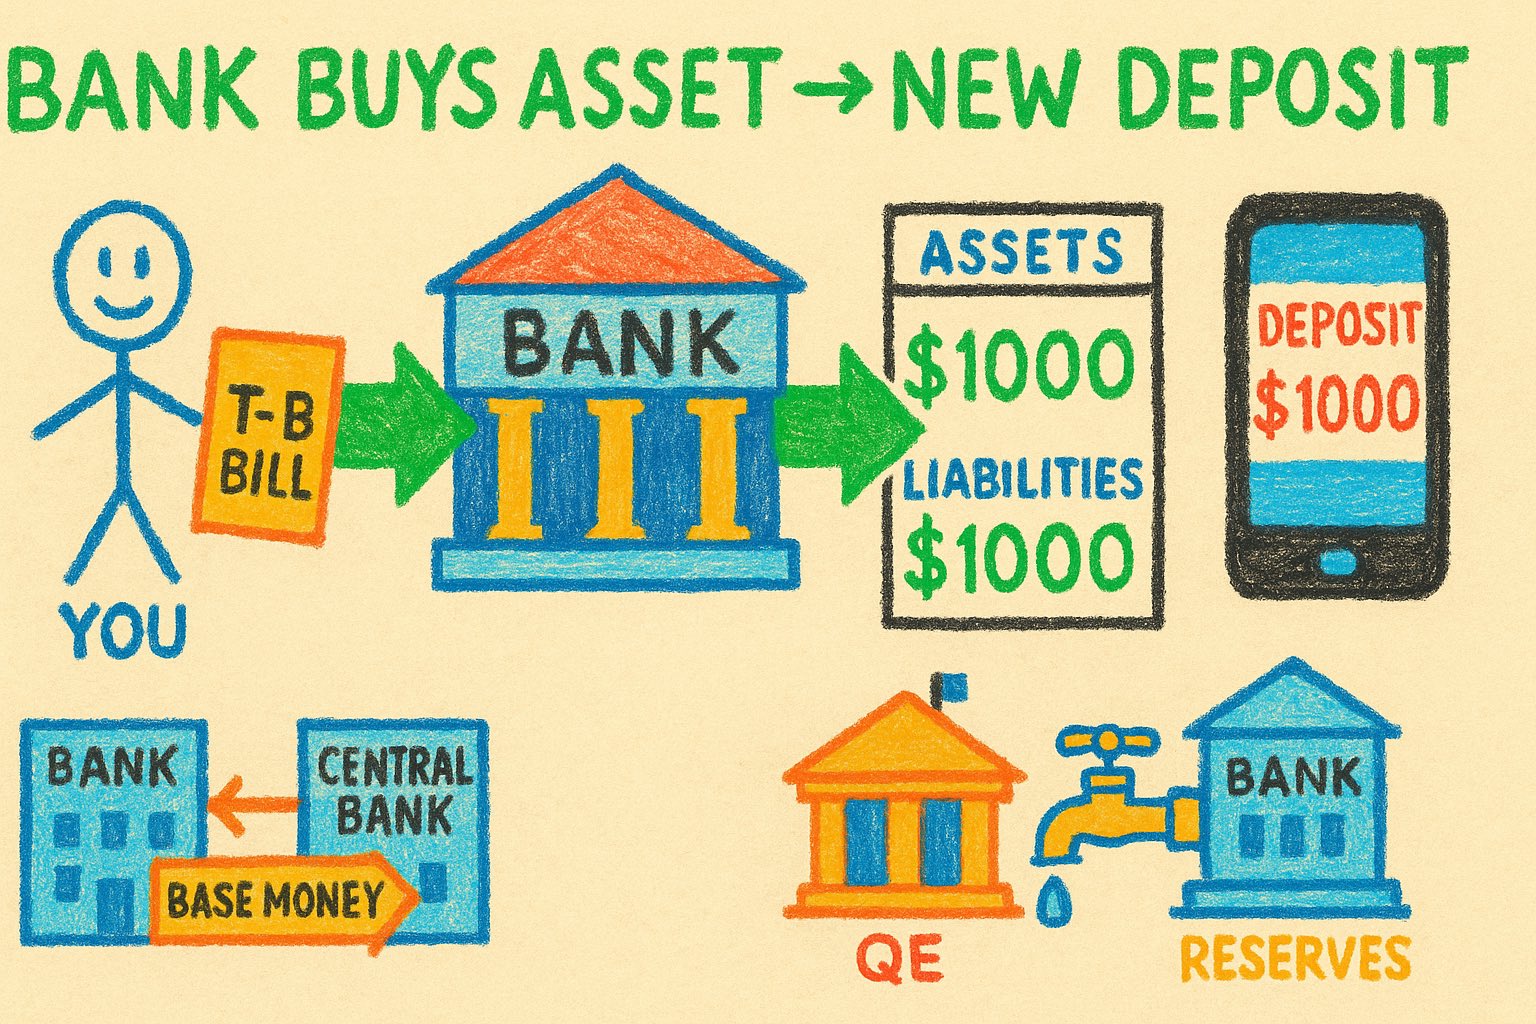
let's say the bank bought a T-bill from you for $1000. for this, they "created $1000" and deposited them into your account. bank’s balance sheet:
➖ Assets: +$1000 (the T-bill)
➖ Liabilities: +$1000 (the deposit/payment to you)
the key here is that you are a NON-bank
when a bank buys an asset from a non-bank it creates broad money
if a commercial bank buys a US Treasury bill from you, it will pay you by create a new deposit into your account
so effectively the bank pays you by creating new digital currency and crediting it into your account
the next burst in global liquidity/larger financial crisis will only happen after several more rounds of QE
the next round of QE is close, but hasn’t even started yet and rates were not cut. however, the next big debt refinancing is underway
still, at some point QE's won't be able to prevent a prolonged negative impact on the market - the top of the cycle or close to it
we're not there yet
in conjunction, this creates an upward pressure in the global liquidity for the near future
of course, this also builds up on leverage in the form of market-wide carry trades, and duration mismatching in the form of rolling over of debt by the Treasury
i explained how weaker US dollar increases cross-border USD liquidity in this thread: https://illya.sh/threads/@1755216337-1.html