My Thoughts
Short-form commentary on macro, market structure, commodities, Bitcoin, crypto markets, and AI.

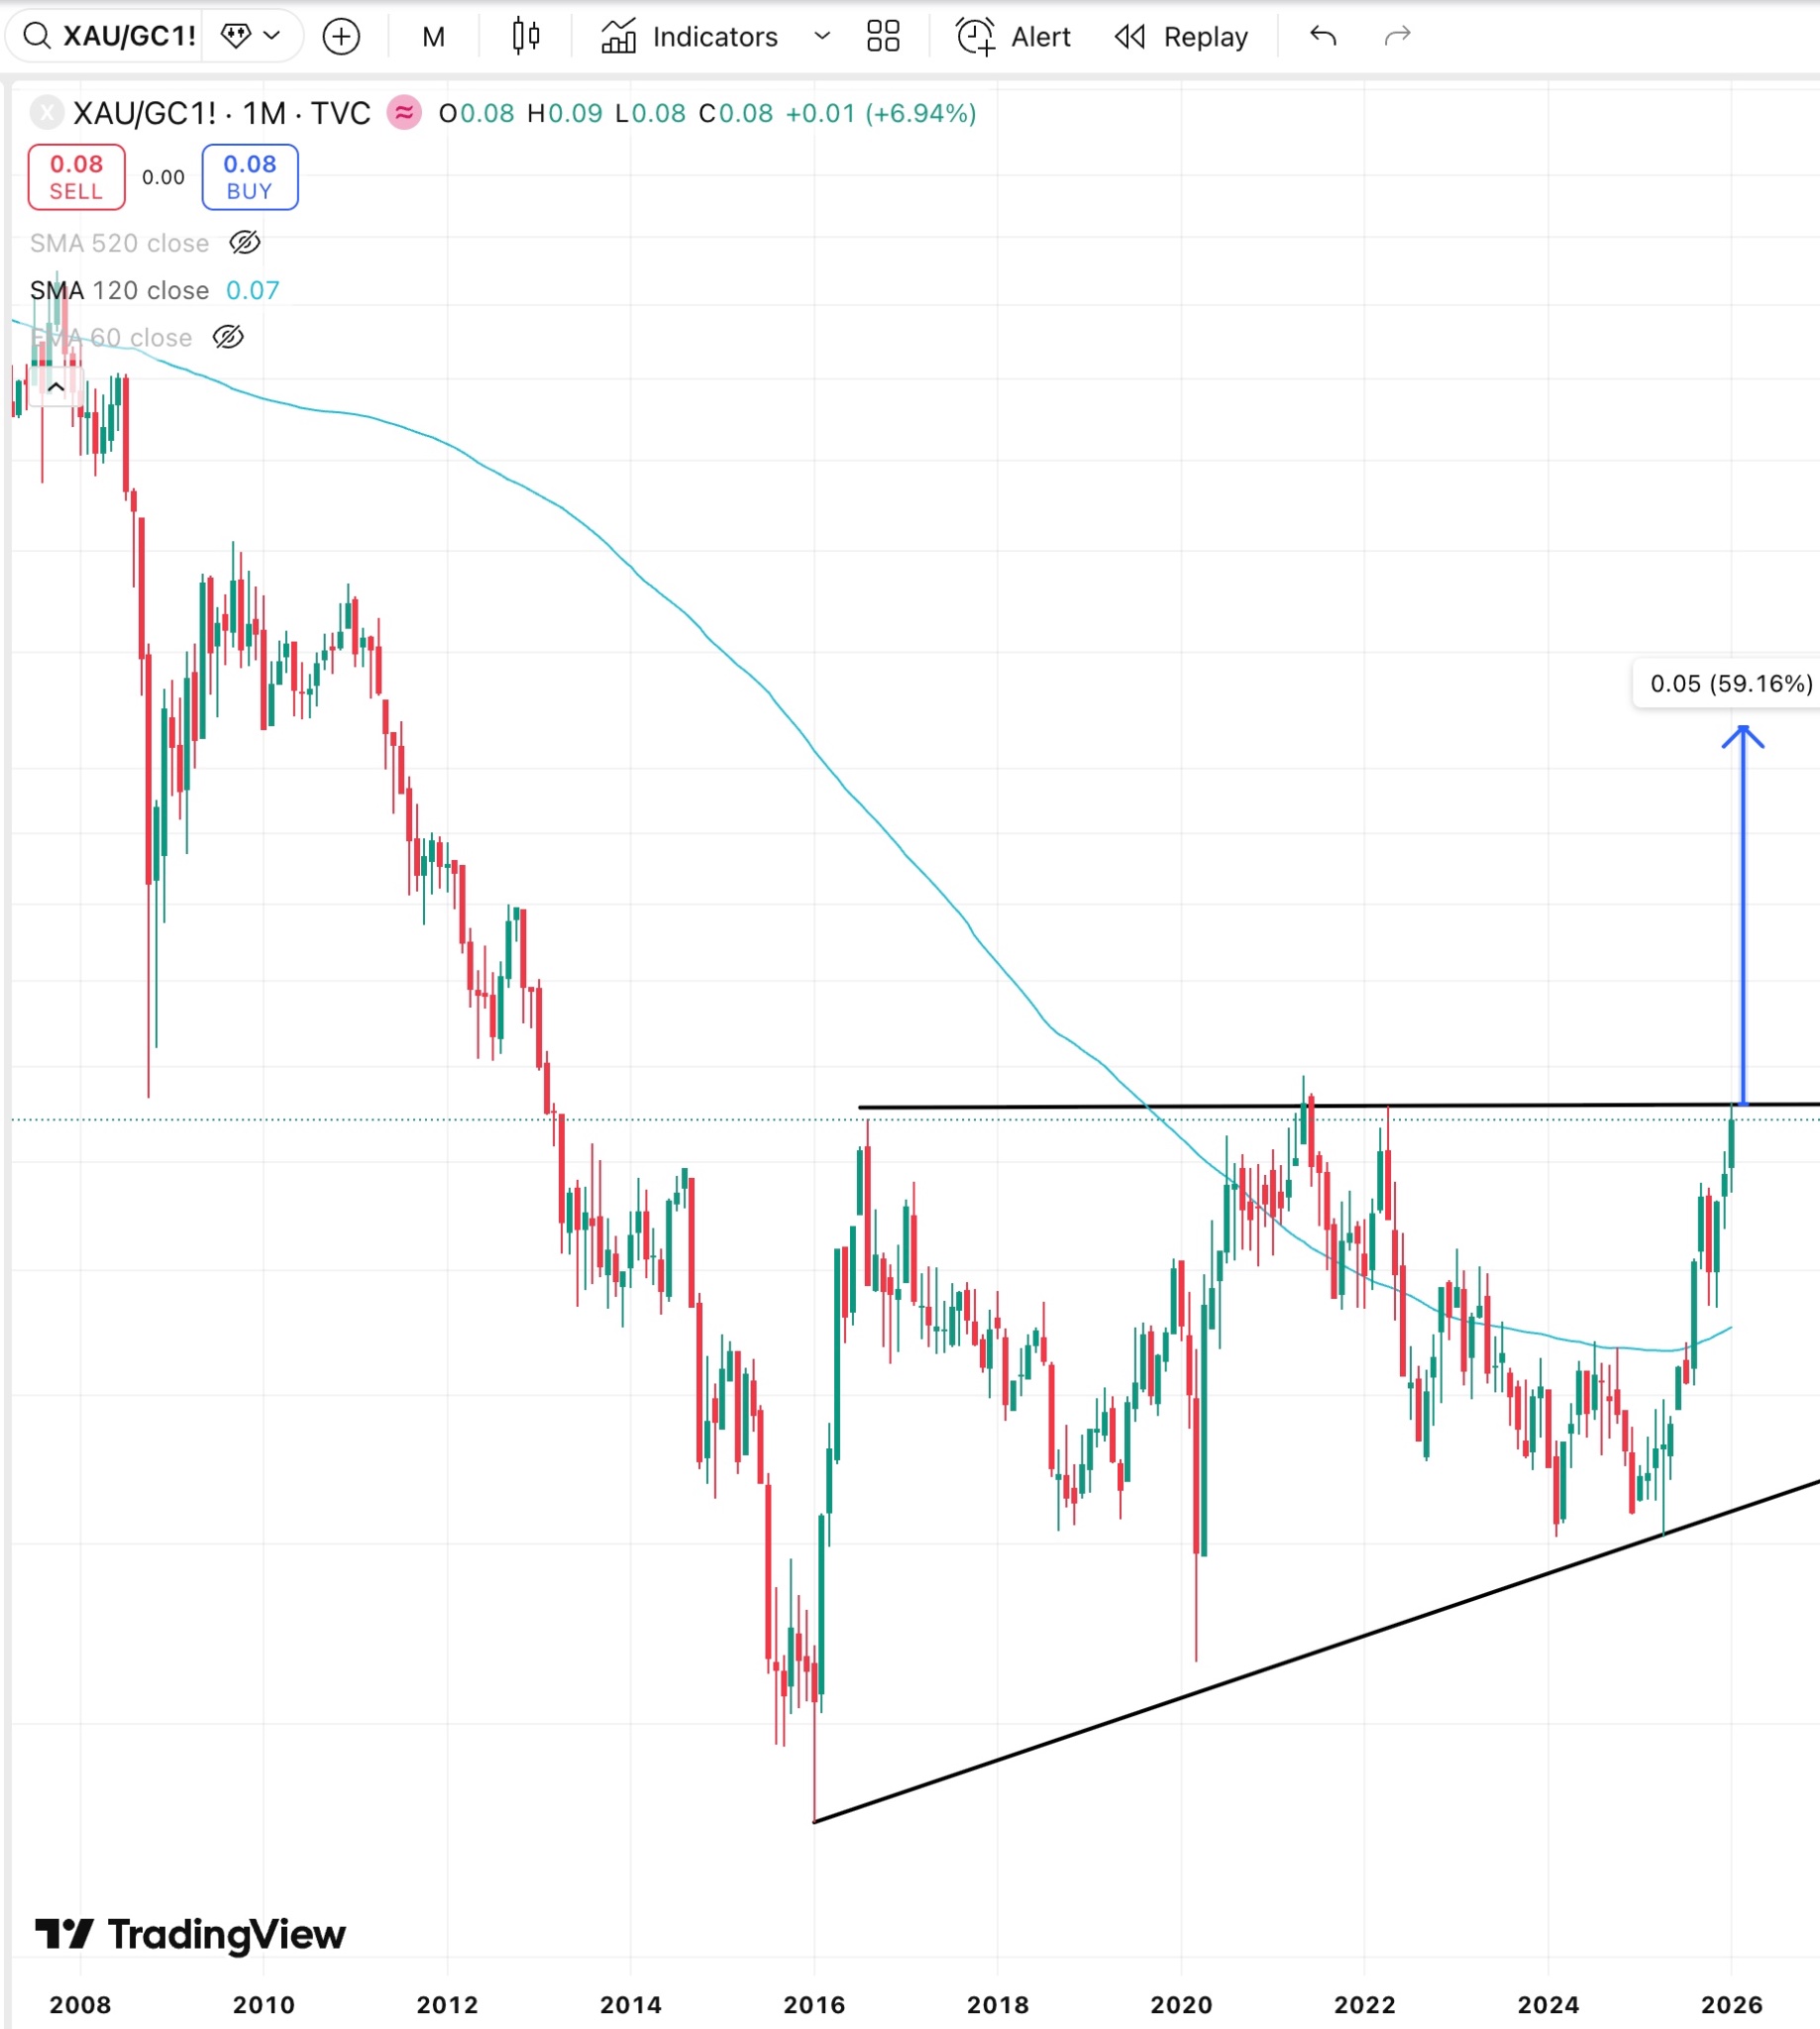
Gold miners are about to breakout
It looks like gold miners are about to appreciate relative to gold, as you can see on the multi-year ascending triangle on the chart. Given that I don't expect gold to have any significant medium-to-longterm pullbacks, this means that gold mining stocks are setup to appreciate more than gold.
The next significant medium to long-term resistance zone is ≈60% higher, meaning that miners have room to appreciate significantly more relative to the price of gold.
The chart is on a monthly level and it shows the ratio between the price of gold miners index and gold futures.
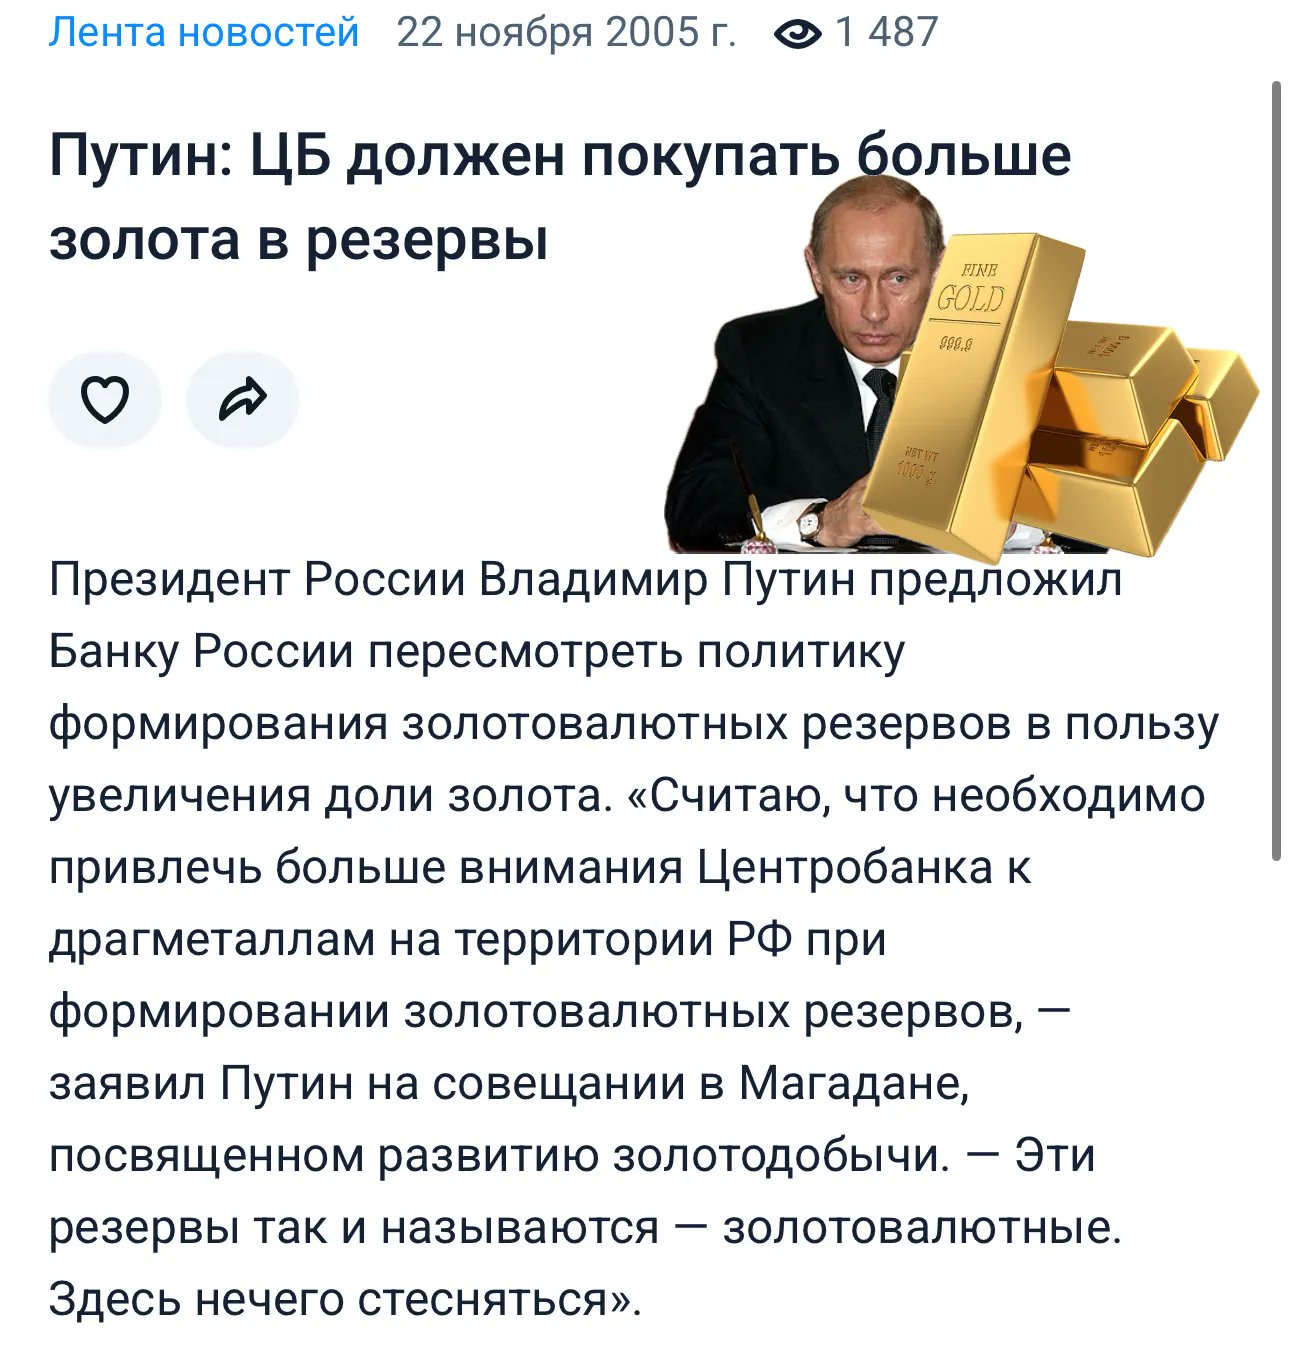
Putin Instructed Central Bank of Russia To Buy Gold In 2005
In 20 years, Russia's share of gold in their central bank's international reserves account increased by a factor of ≈12.1 times.
At the start of 2026, gold represents ≈43% of Bank of Russia's (BoR) international reserves. Back in 2005, gold accounted for a mere ≈3.5% of the same reserves account.
The move to gold was mainly motivated by the desire to diversify away from the U.S. Dollar and the explicit goal of increasing BoR's holdings of gold relative to foreign exchange assets. On November 22nd 2005 Putin stated:
➖ "I believe it's necessary for the Central Bank to pay more attention to precious metals within the territory of the Russian Federation when forming gold and foreign-currency reserves. Those reserves are even called 'gold and foreign-currency' reserves. There's nothing to be shy about here."
Since Vladimir Putin instructed Bank of Russia to start buying more gold, gold is up ≈840%, i.e. almost 10 times. In the same period, S&P 500 TR increased ≈726%, or almost 9 times. This means that Putin's strategy outperformed the U.S. stock market index by ≈14%. Perhaps the president of Russia should start his own investment fund?
You can read the full article on gold revaluation, its low-level mechanics and impact on the U.S. here ⬇️
https://illya.sh/threads/gold-revaluation-will-not-solve-the-us-debt-problem
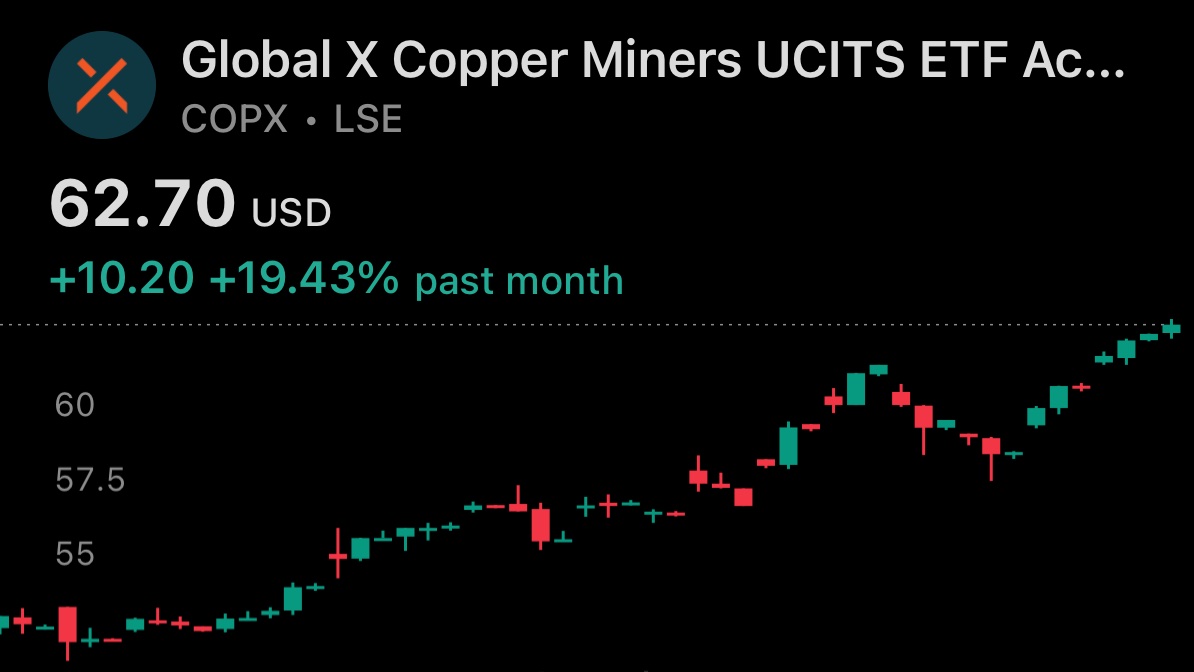
If you want to invest in copper miners, just go with the Global X Copper Miners ETF
This is especially true if your main goal is getting exposure to the price action in the copper mining segment without spending too much time on it.
Not saying that you shouldn't invest in individual equities, but don't invest in a company just because someone mentioned their ticker on the internet.
Diversifying makes all of the sense in these cases in terms of risk/reward.
This exchange-traded fund is domiciled in the U.S., but also available to retail EU investors via an equivalent UCITS product, so you should be able to find it listed by your preferred broker.
Fund information:
➖ Ticker: COPX
➖ U.S. ISIN: US37954Y8306
➖ EU ISIN: IE0003Z9E2Y3
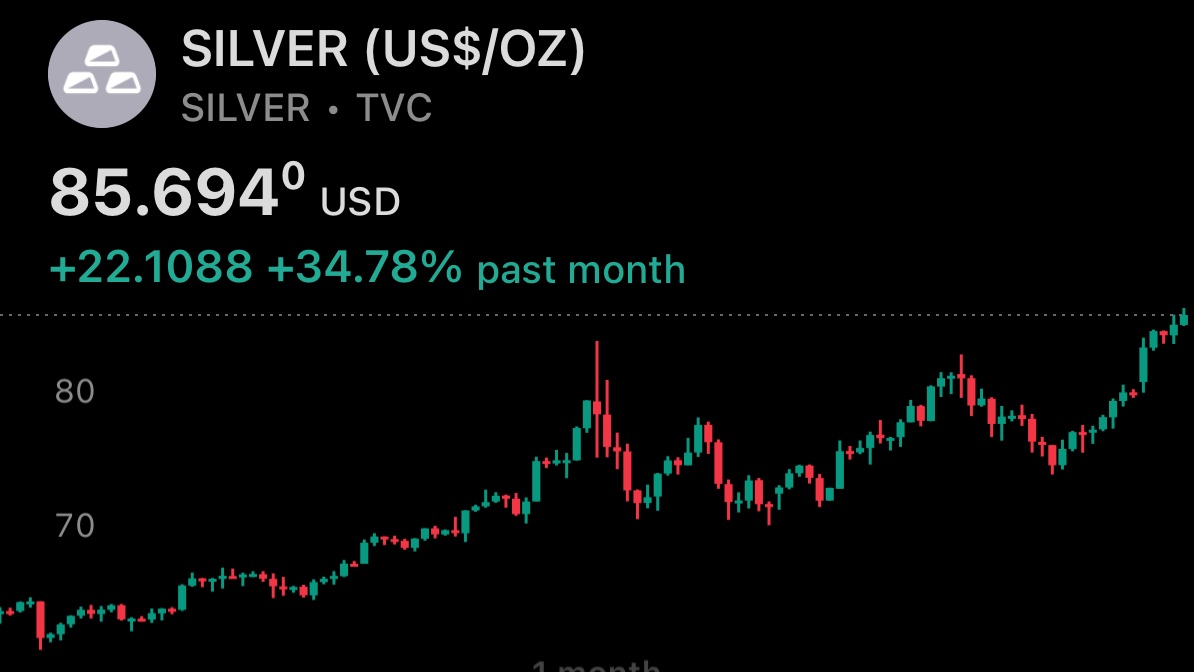
So silver didn't top for the cycle, 2011 didn't repeat and instead less than 2 weeks later it hit another all time high
Imagine my surprise 😄
More all time highs are coming and, as I've written before, you can safely ignore any calls for long-term top.
You can't find a top on chart without understanding what drives the price on that chart in the first place. Luckily for you - I've written a lot of explanations on that when it comes to gold and silver
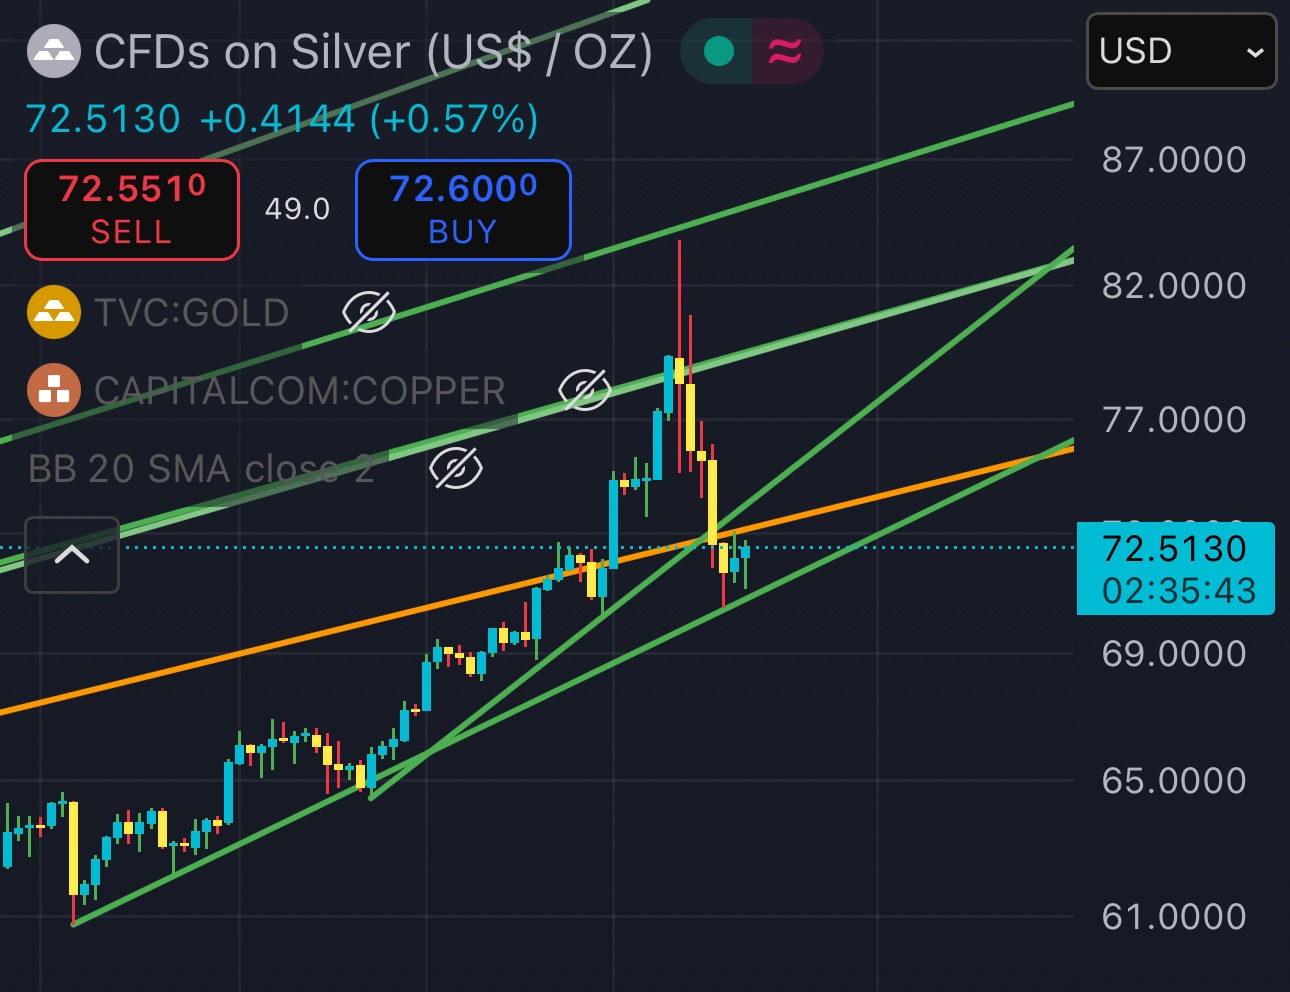
Silver didn't even break its 4 hour trend support on the pullback and many are already calling that it has topped for the cycle 😂
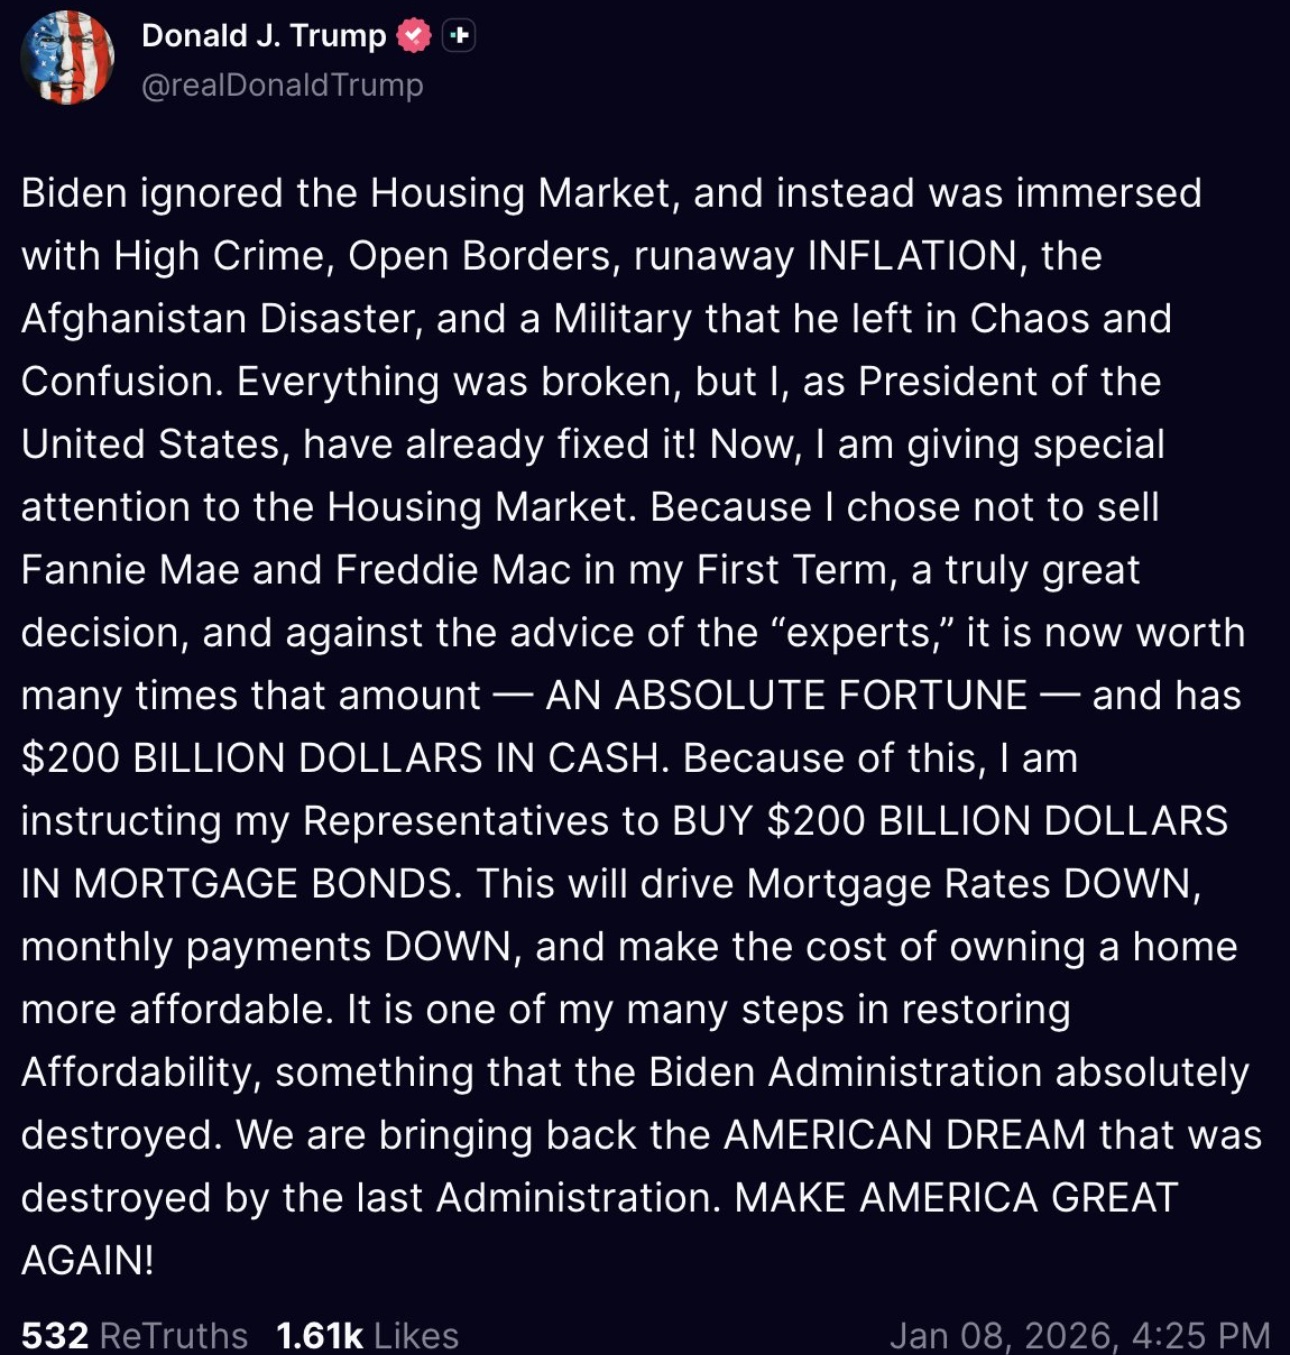
Congratulations to Freddie Mac & Fannie Mae in their first steps at becoming a central bank
Looks like it's not just the Fed doing MBS-targeted QE now. Why control the Fed, when you can just move the Fed? 😆
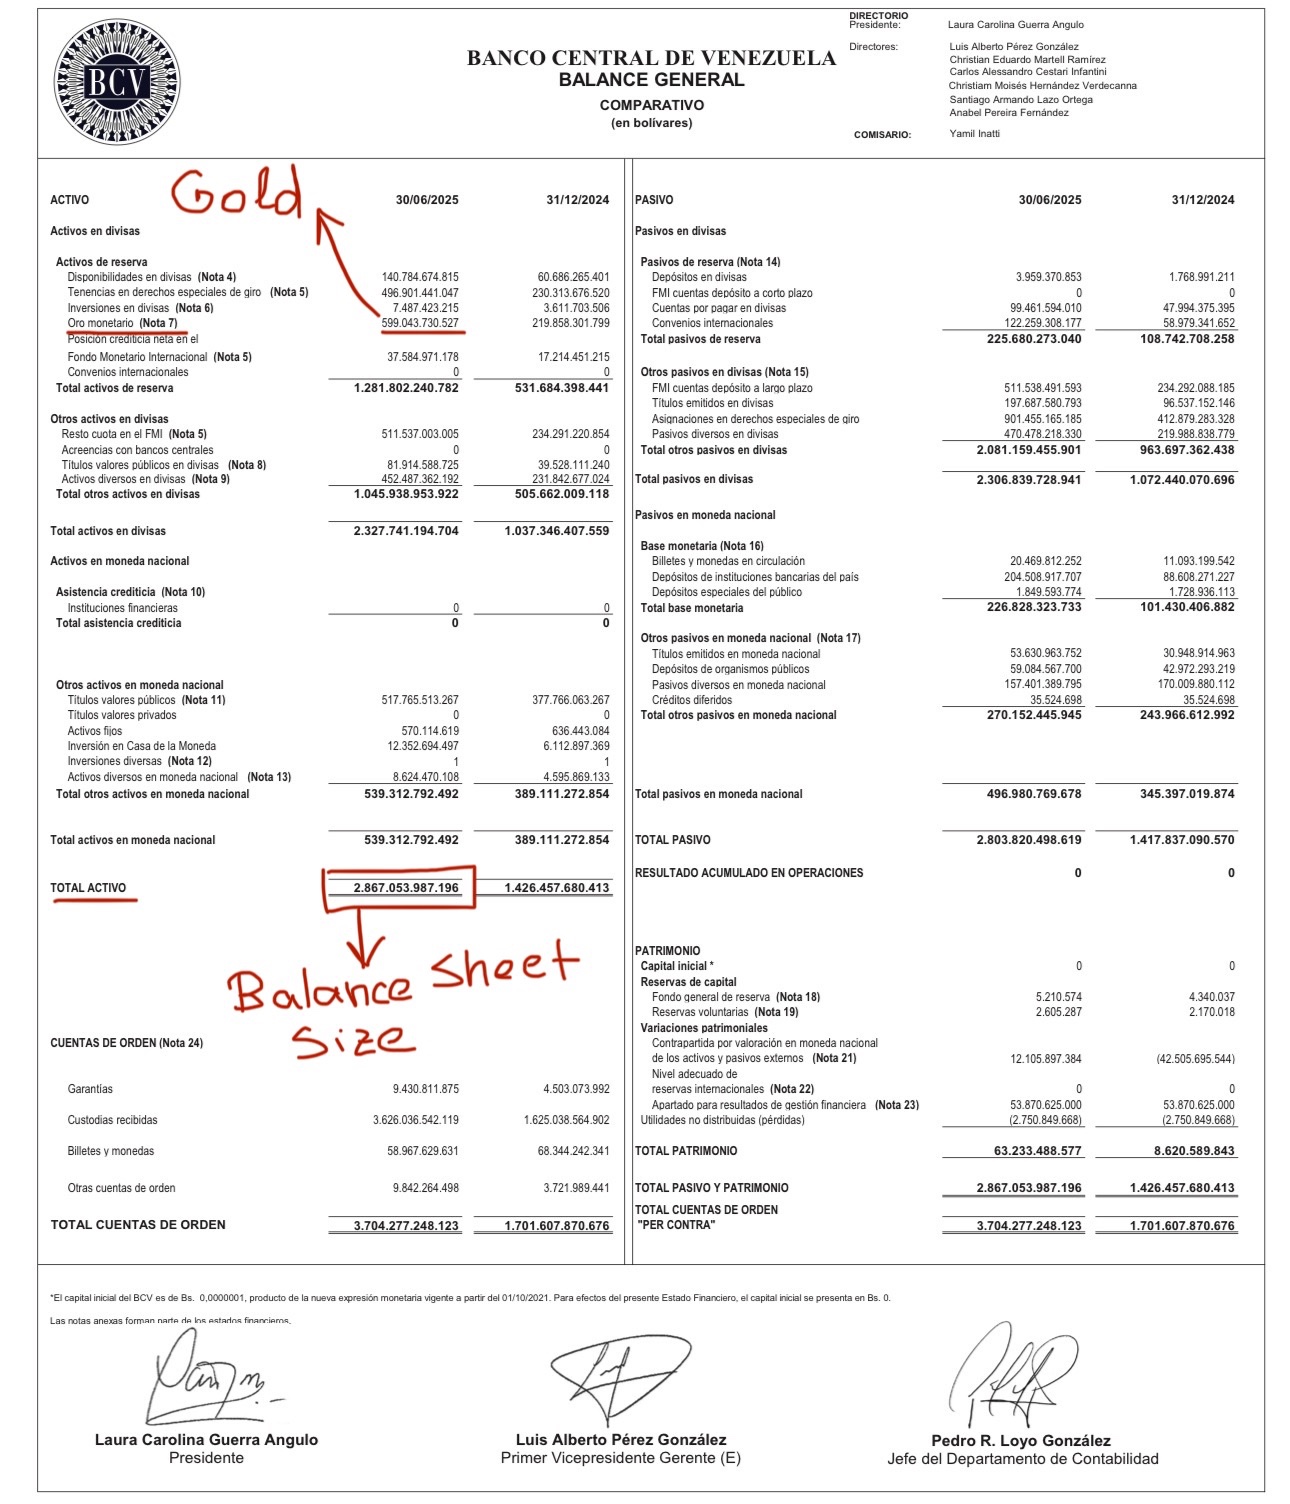
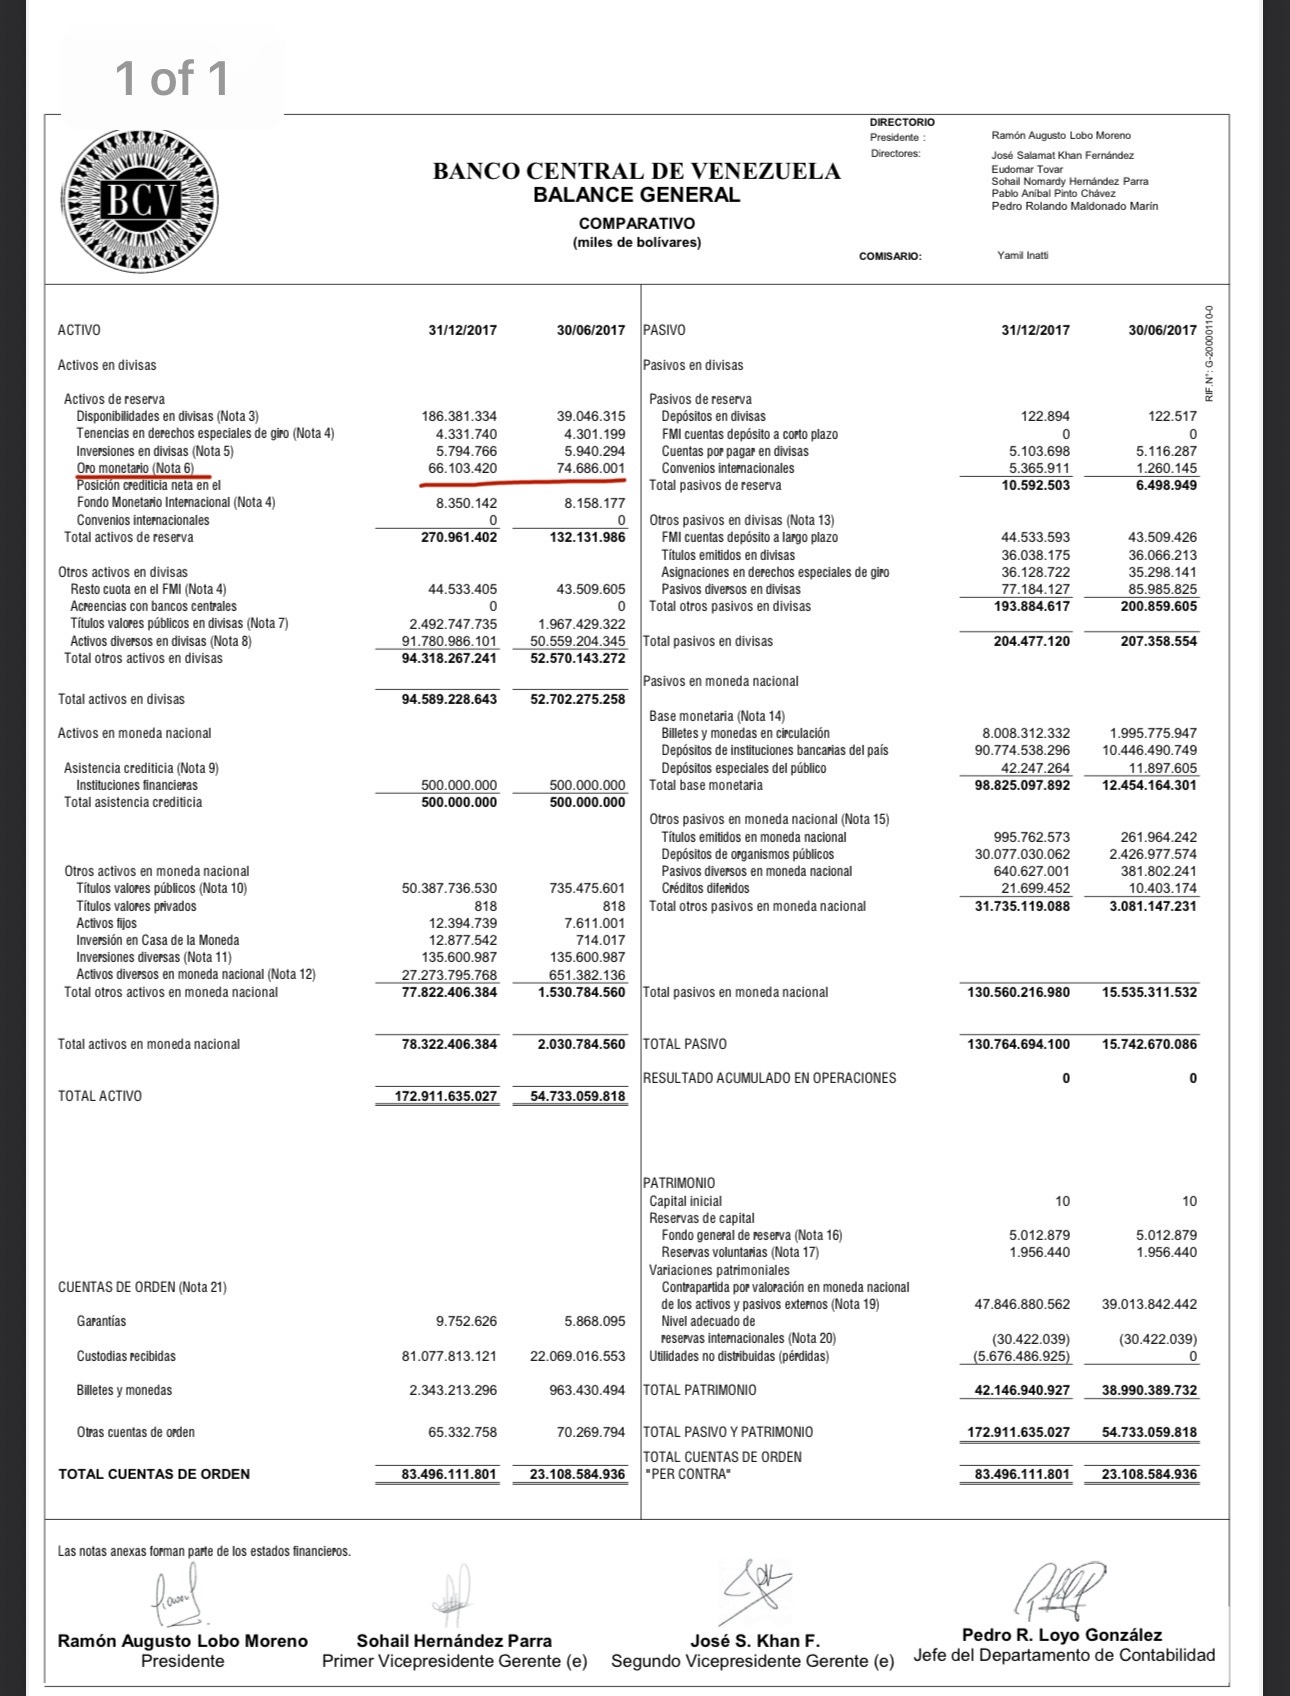
Venezuela's Central Bank Monetary Gold Holdings Constitute ≈20% of Their Balance Sheet
Gold is also ≈47% of Venezuela's international reserve assets.
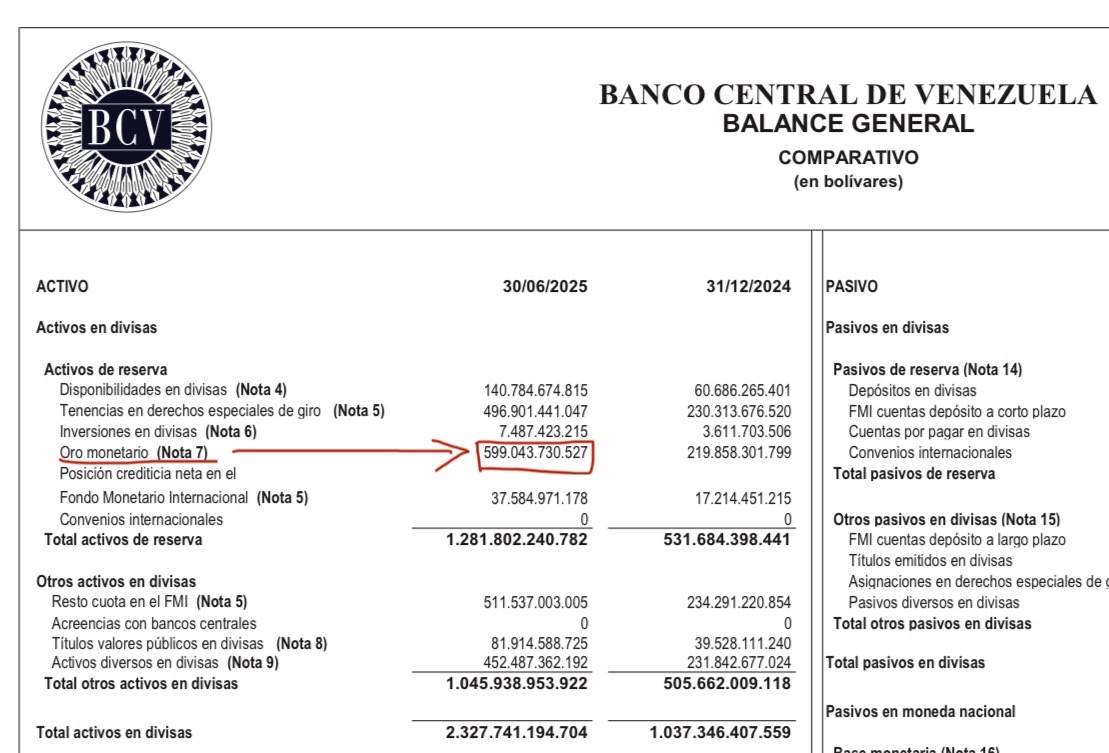
This comes directly from Banco Central de Venezuela (BCV), which reports a total of ≈53 tonnes of gold worth ≈0.6 Trillion VES (Venezuelan Bolívar, also known as Bs), or ≈5.58 billion USD.
In 2021, Reuters reported that ≈31 tonnes of Venezuela's Centeal Bank gold was stored in the UK, under the custody of Bank of England (BoE). A quick search didn't yield precise figures for 2026, as it appears that that information is not reported publicly in detail. The access to that gold at BoE is currently blocked, over a legal dispute regarding who has the authority/control over that gold - Maduro-appointed BCV board or Guaidó-appointed board. Thus, a significant portion of Venezuela's gold is abroad and frozen, which matters in terms of geopolitical risk.
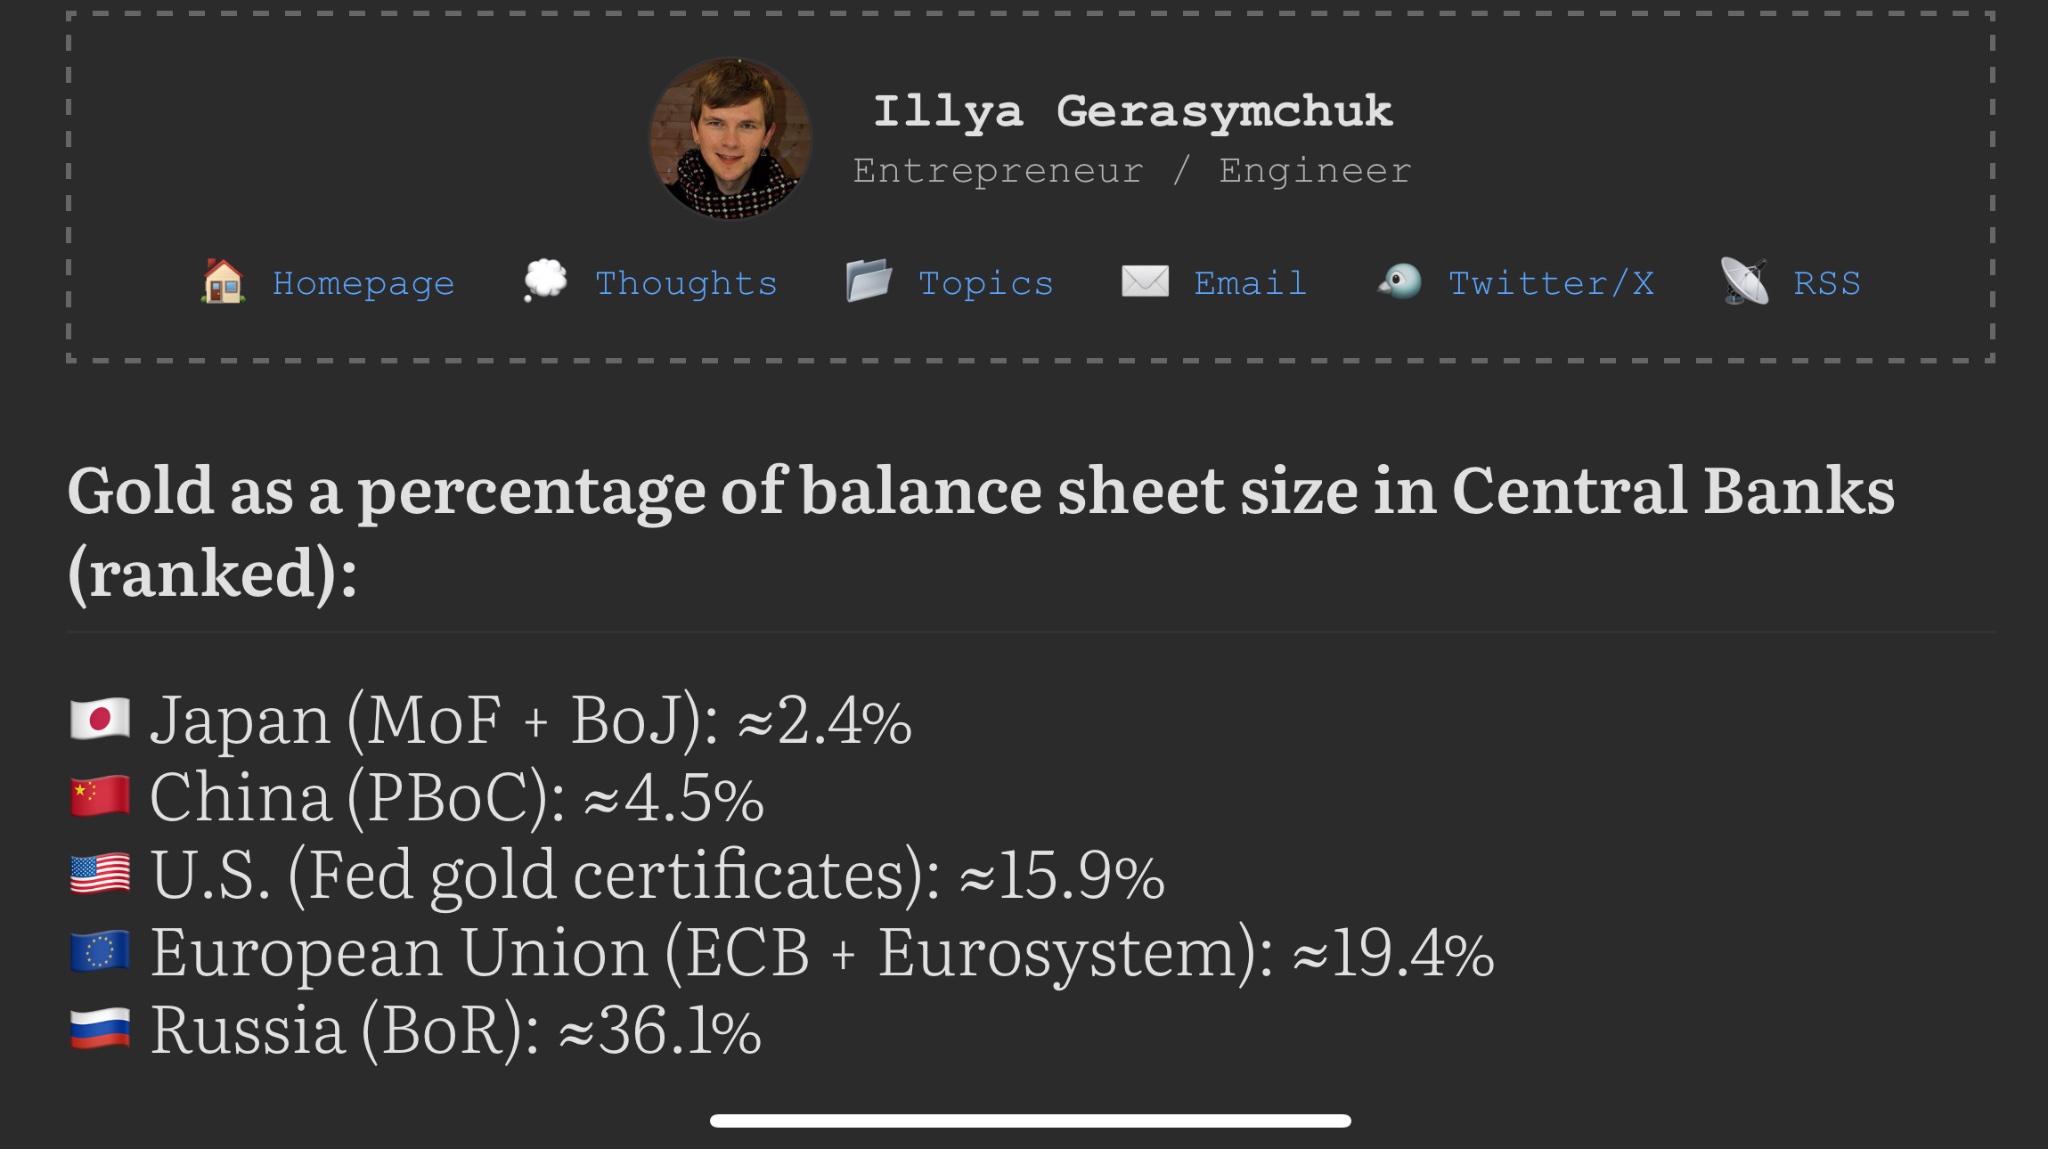
BNV's 20% are relatively high gold amounts against the central bank's total balance sheet size, surpassing U.S.'s Fed (≈16%), China's PBoC (≈5%) and just above European Union's ECB + Eurosystem (≈19.1%), but well behind Russia's BoR (≈36%).
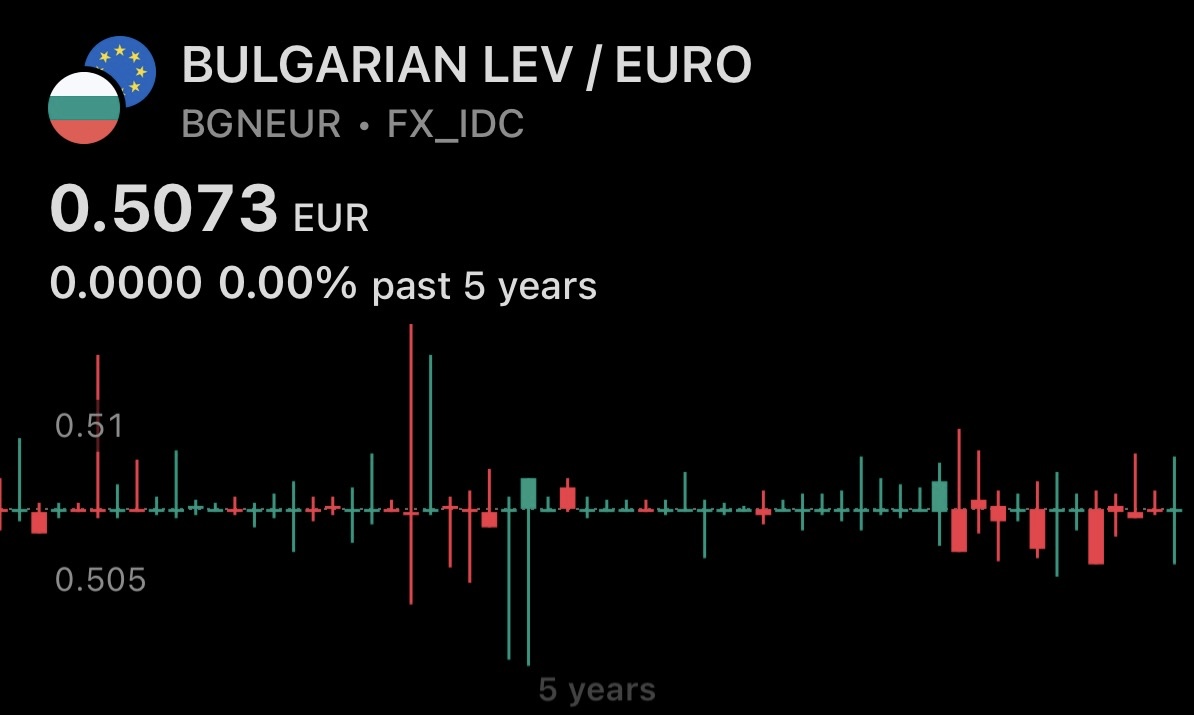
Bulgraria has been pegged to Euro since 1999 🇧🇬
Bulgaria has adopted Euro as its official currency and legal tender on January 1st 2026.
As you may have expected, there is now a lot of discourse about how this is bad for Bulgaria, because Euro is bad and Bulgaria has now given up their "monetary sovereignty".
What the ones pushing that narrative have not expected is for the Bulgarian lev (BGN) to be a proxy for Euro for almost 3 decades now. So it's not very clear which sovereignty Bulgaria gave up on January 1st 2026, when it became a full Eurozone member.
Since 1997 Bulgaria has operated under a currency board arrangement (CBA), which is an exchange rate regime where a country commits to keep its local currency to a fixed exchange rate against an anchor currency.
Under CBA, the adhering country fixes the exchange rate of its local currency to an anchor currency, its national central bank fully backs its monetary liabilities with foreign reserves (to create local currency the national central bank must have foreign currency assets to back it up, thus ensuring stable convertibility), and the country foregoes its right to adapt discretionary monetary policy (e.g. inflation rate targeting).
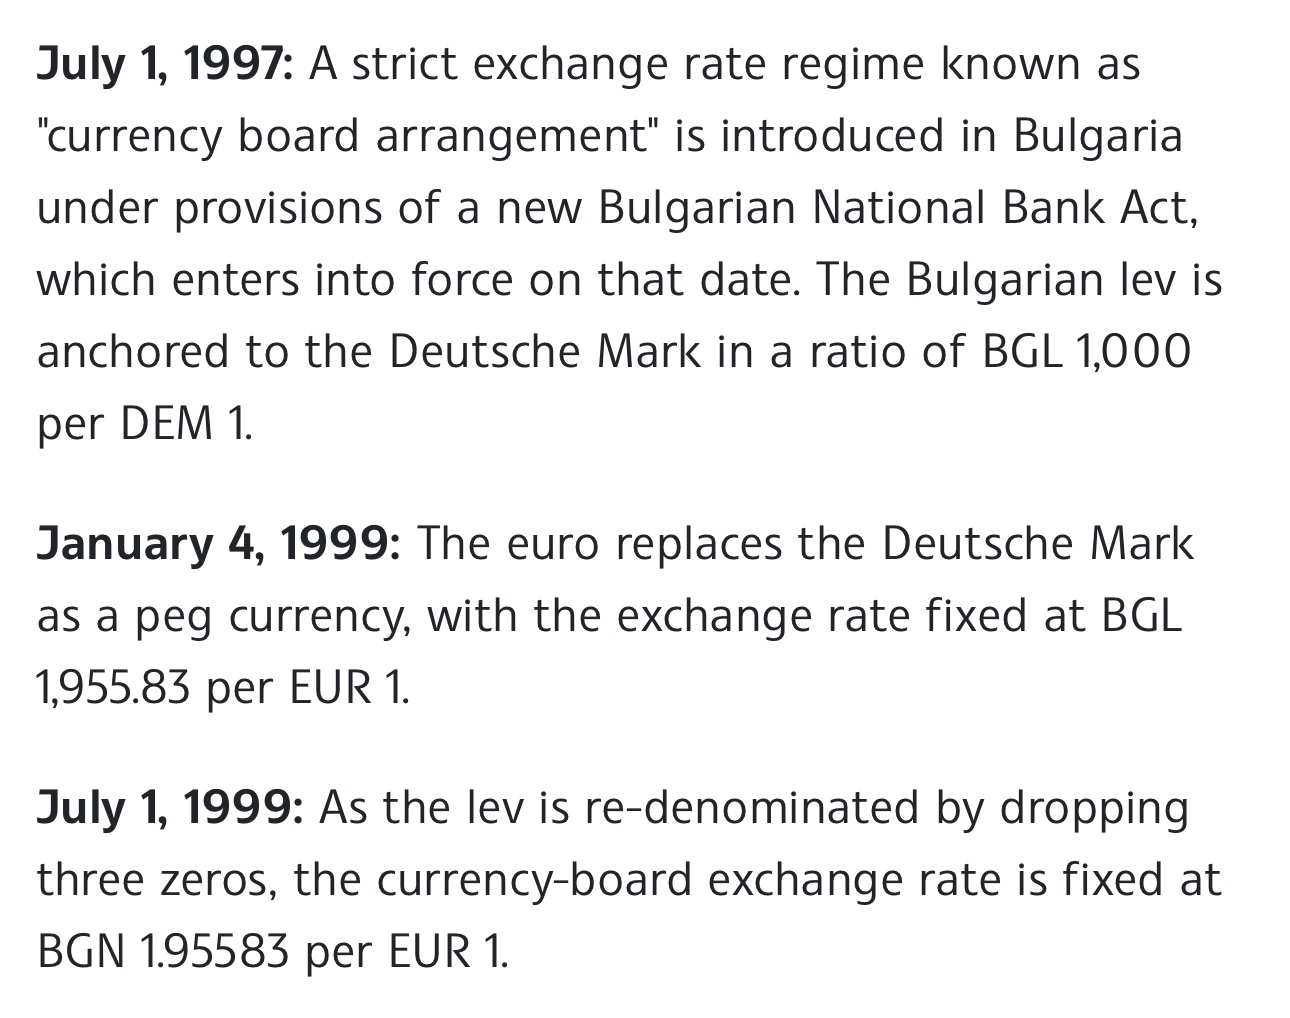
On July 1st 1997, Bulgaria introduced the currency board, pegging lev (BGL) to the Deutsche Mark (DM). On January 1st 1999, Bulgaria switched the anchor currency from Deutsche Mark to Euro, with the exchange rate fixed at €1 = 1.95583 BGN (≈0.5 BGN/EUR).
So the Bulgarian National Bank (BNB) neither had the sovereignty to manage the broad and base supplies of its local currency (Bulgarian lev/BGL/BGN), nor to freely pursue monetary policies since July 1st 1997.
Given this, any discourse about how Bulgaria's entry into the Eurozone implies a dramatic change to its monetary sovereignty is likely unfounded. It didn't happen overnight - it's been an almost 30 year long process. Joining the Eurozone does, however, remove the pegging frictions for Bulgaria, and allows them to fully integrate into the monetary union.
The U.S. Violated International Law By Attacking Venezuela and Capturing Maduro
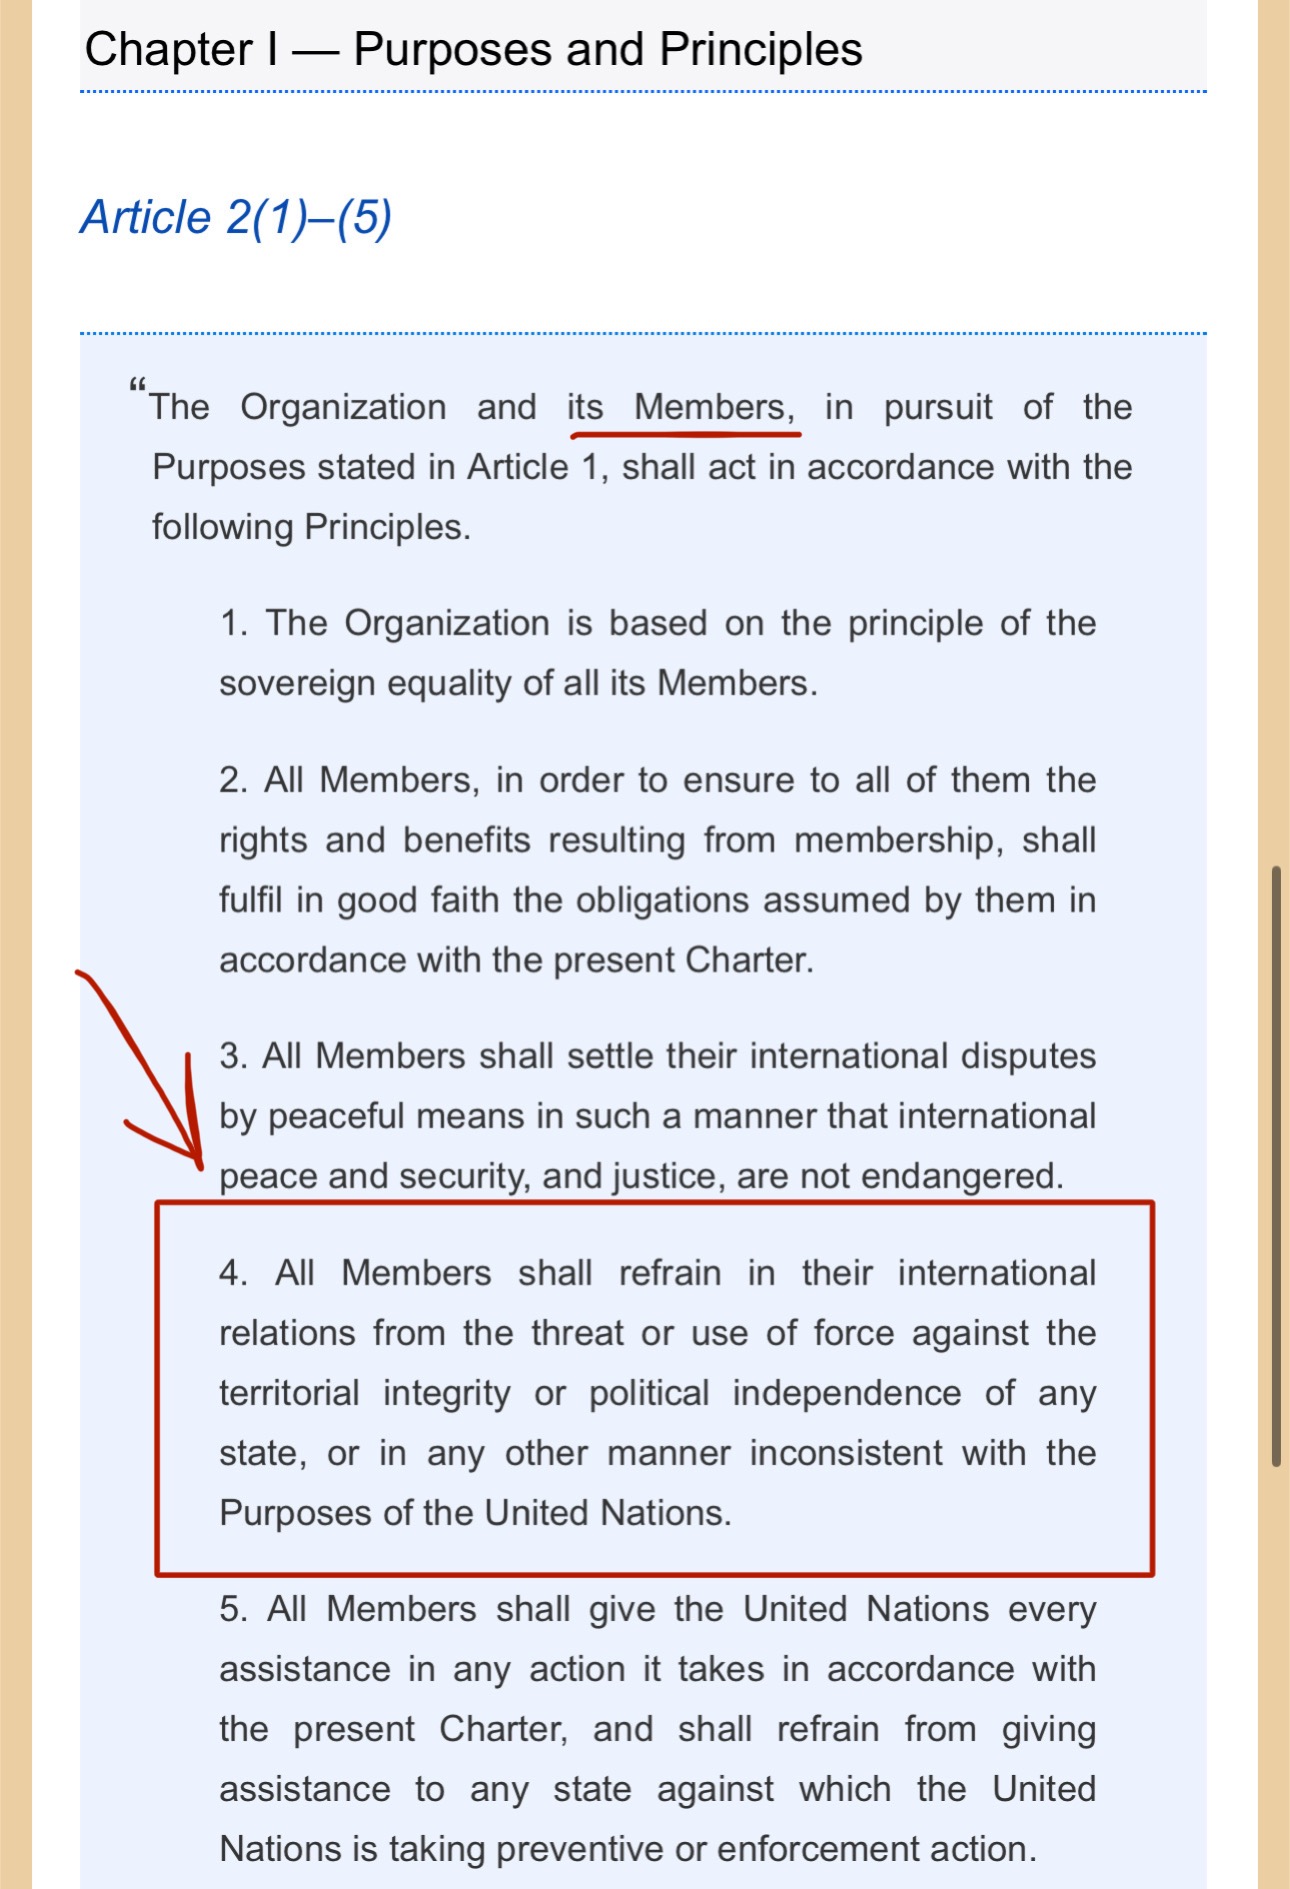
Both the U.S. and Venezuela are signees & parties of the UN Charter, making it a legally binding treaty for both countries. This means that both of the countries are forbidden from using force against sovereign states, as per Article 2(4), which states:
➖ "All Members shall refrain in their international relations from the threat or use of force against the territorial integrity or political independence of any state, or in any other manner inconsistent with the Purposes of the United Nations."
Crossing the border with military force to seize someone is clearly a "use of force" against that state, meaning it's a violation of the provision.
There are some exceptions to Article 2(4), such as self-defense in responding to an armed attack (Article 51), prior authorization for force by the UN Security Council and . United State's actions do not fall under those exceptions. As such, USA is in violation of Article 2(4) of the UN Charter, making their actions illegal under the international law.
Even if the U.S. that they are not in violation of their national laws, they would still be violating the international law. Vienna Convention on The Law of Treaties (VCLT) is the "treaty about treaties", by outlining base rules for how treaties are made, interpreted, applied and ended. Article 27 of VCLT states:
➖ "A party may not invoke the provisions of its internal law as justification for its failure to perform a treaty."
Regarding VCLT, the U.S. signed it in April 1970, but they didn't ratify it/they're not a party in it, meaning it's not a directly legally binding treaty for the U.S. However, U.S. courts often treat VCLT as an authoritative guide to customary international law of treaties.
Additionally, Article 103 of the UN Charter puts the obligations outlined in the UN Charter above any other treaty obligations, meaning that Article 2(4) must be respected:
➖"In the event of a conflict between the obligations of the Members of the United Nations under the present Charter and their obligations under any other international agreement, their obligations under the present Charter shall prevail."
If the U.S. takes military action against Cuba, Cambodia, Denmark (Greenland) or any other sovereign in a similar manner, it would equally be a violation of the international law.
Interestingly enough, in 1945 the U.S. helped to draft the same UN Charter that it is now violating.
It's NOT about paying the debt, but BEING ABLE to pay the debt
This is true for corporations, individuals and governments:
➖ For corporations, debt provides a tax shield (interest payments is an accounting expense)
➖ For individuals, it allows to front-run price increase in a monetary debasement/inflationary economy
➖For governments, it allows for more flexibility in pursuing their macroeconomic, social, geopolitical and monetary policy goals.
Why do you think central banks have gold and foreign currencies in their balance sheet backing up their local currency? It's about having enough assets and liquidity to cover your liabilities.
Misinformation About Venezuela's Gold Reserves Is Spreading 🇻🇪
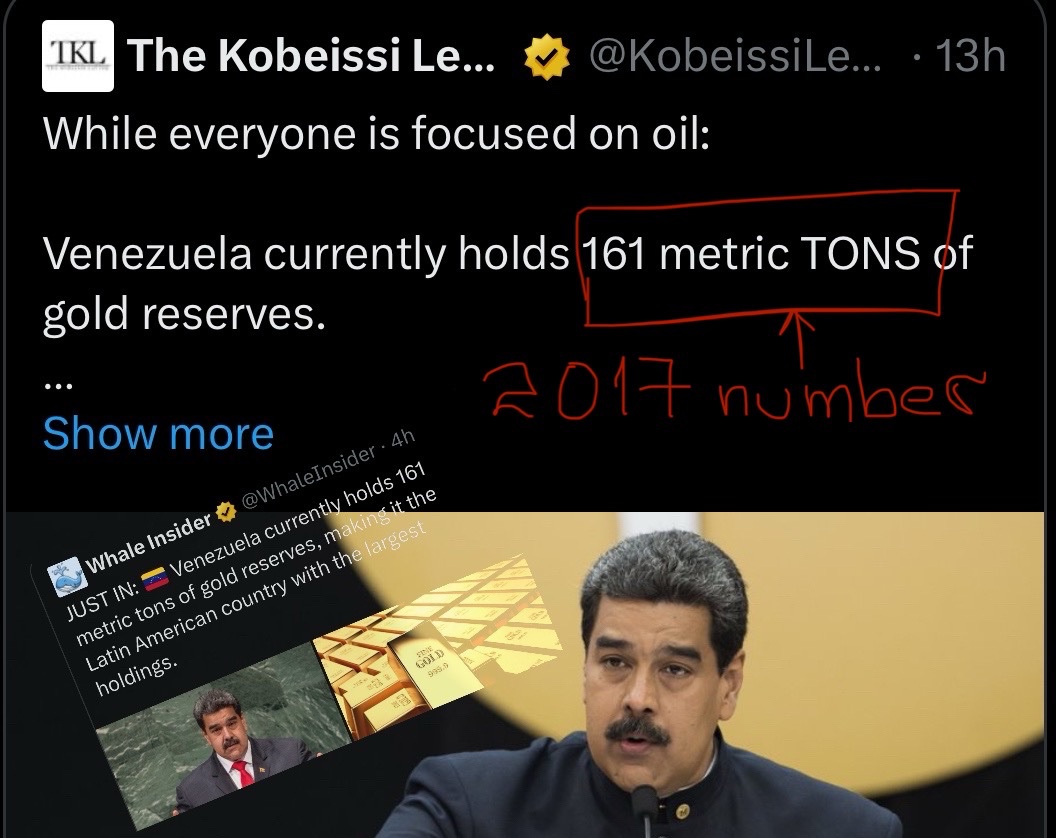
It appears that once a large finance account on X posts misinformation about Venezuela's gold reserves, many other large-following X accounts repost it without even bothering to verify the information.
Banco Central de Venezuela (BCV) doesn't have anywhere close to 161 tonnes of gold - those are numbers from 2017. BCV's balance sheet report, alongside the auxiliary notes released with it (specifically Note 7) from June 30th 2025 point at ≈53 tonnes of gold, which is less than a third of the claimed 161 tonnes of gold figure. I know this for a fact, because I checked that balance sheet statement myself.
On my feed, the incorrect 161 tonnes figure started with @KobeissiLetter post earlier today, from there, it continues to spread throughout numerous accounts, many of which have followings in the millions.
My goal is not to criticize or attack the accounts spreading this incorrect information, but to incentivize checking the information yourself before reposting/spreading it.
In a follow-up post I'll do a more detailed breakdown of BCV's balance sheet, especially in terms of gold, so stay tuned.
As or 2026, Venezuela has ≈53 tonnes of gold, not 161
I've taken these numbers directly from Banco Nacional de Venezuela (BCV) balance sheet for 30th June 2025.
I am now seeing claims about Venezuela having 161 tonnes of gold, which are incorrect. The 161 tonnes likely refers to the 2017 amounts BCV held.
In 2017, Venezuelan Central Bank (Banco Central de Venezuela/BCV) held ≈162 tonnes of monetary gold in its balance sheet
By 2025, that number was reduced by ≈67%, down to ≈53 tonnes.
I'll do a more detailed breakdown of Venezuela's gold holdings relative their balance sheet size in a follow-up post.
Ruble was the best performing major currency of 2025, and it's easy to understand why
What Russia did is replace USD-denominated securities (treasuries, bonds, etc) with gold.
Gold is almost 40% of Russia's Central bank balance sheet, compare it to ≈20% for European Union, ≈16% for U.S. and ≈5% for China. This leaves Russia's central bank with a massive balance sheet capacity for the future and supports the Ruble price.
There's also the National Wealth Fund, which commits to buying gold when Urals oil is sold/traded above a certain price.
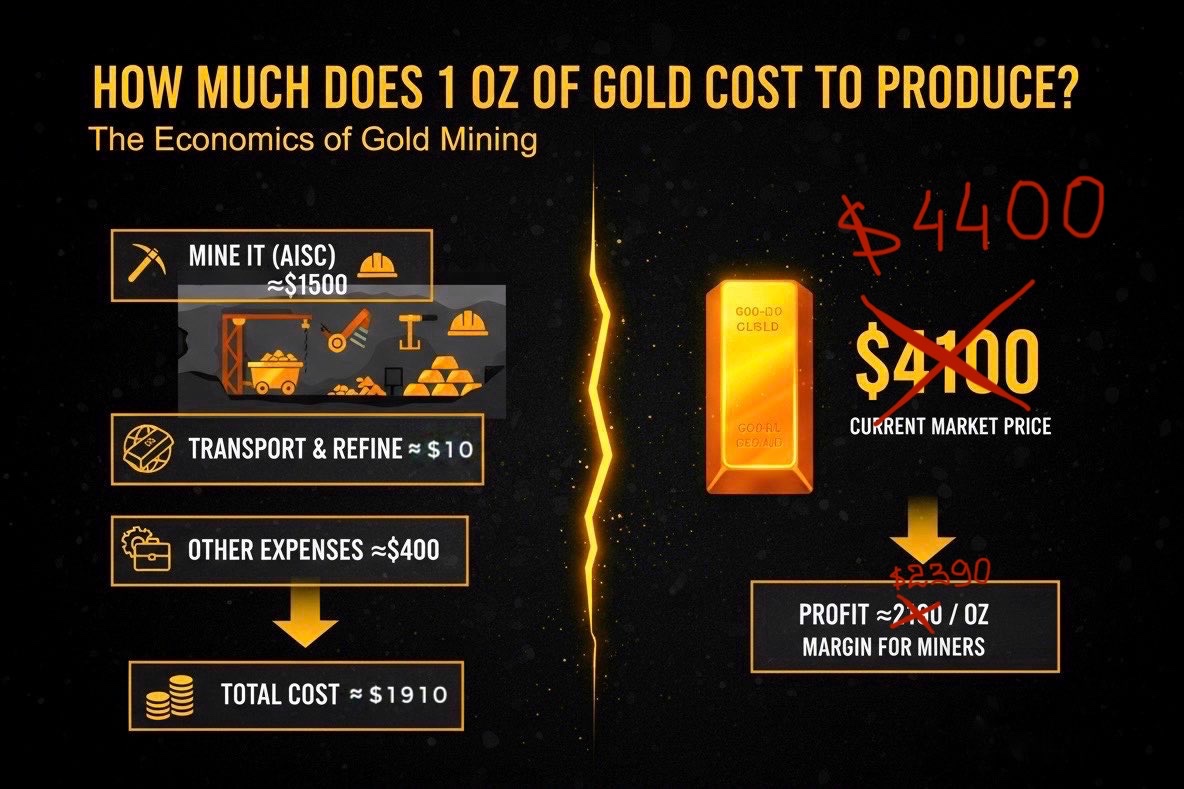
The big play on precious metals mining stocks is that production costs remain (much) smaller than the metal's spot price
For gold - the cost to produce/mine 1 oz is roughly $2000. Then, those same miners sell it for more than $4000. Instant >$2000 profit per ounce (again, rough numbers) 😄
So from the current levels, assuming production costs increase less than the spot price of the metal - miners win big. I believe this will be the case.
I wrote a more detailed article explains gold mining costs and miner profits here: https://illya.sh/threads/1-oz-of-gold-production-cost-and-miner-profit
LLMs & AI Agents Didn't Replace Programming - They Evolved It
I've been programming with LLMs since 2022, implementing systems of varied complexity, both professionally and exploratory/hobby projects. And I will continue to do so in 2026. However, it's important to be aware of its limits.
Vibe/agent coding for critical systems doesn't work well (yet).
You'll also be disappointed if you're trying to do something with financial markets (e.g. Machine-Learning based models).
Vibe coded apps also frequently come with security vulnerabilities (for many apps this may be an acceptable compromise).
I don't think you'd be comfortable with driving a vehicle with all of its software vibe-coded, or with all code written by an agentic system, without thorough human investment.
LLMs are good at solving problems that have been solved many time before, but this abstraction quickly breaks apart if you delve with them into less developed topics, which frequent tend to be more complex. Pattern matching based prediction is very powerful, but you need enough patterns to learn from, alongside the correct context.
Additionally, vibe-coding a large codebase is one thing, while maintaining that same codebase is another.
Autopilot in commercial airplanes didn't deprecate carbon-based human pilots, but it did deprecate pilots who didn't commit to learning and integrating autopilot during the flight.
So is programming really dead, or has it merely evolved? 🤔
Bulgarian Lev has been pegged to Euro since 1999
Bulgarian National Bank (BNB) has been operating under a currency board arrangement (CBA) regime since 1997. First, it was pegged to the Deutsche Mark, then to the Euro. They also redenominated their currency from Old Bulgarian Lev (BGL) to New Bulgarian Lev (BGN).
Under CBA, BNB's monetary liabilities must be fully covered by foreign reserves. In other words, if Bulgaria's Central Bank wanted to increase the base money supply of their national currency (i.e. monetary liabilities on BNB's balance sheet), they needed to foreign reserve assets backing them up at a fixed rate of 1 EUR ≈ 1.96 BGN. In practice, ≈90% of BNB's reserves were Euro-denominated, which makes sense, since BGN is pegged to the Euro.
For those claiming that by adopting the Euro as its official currency on January 1st 2026 Bulgaria has given up its monetary sovereignty - how exactly? BNB has been extremely limited in pursuing discretionary monetary policies since 1997.
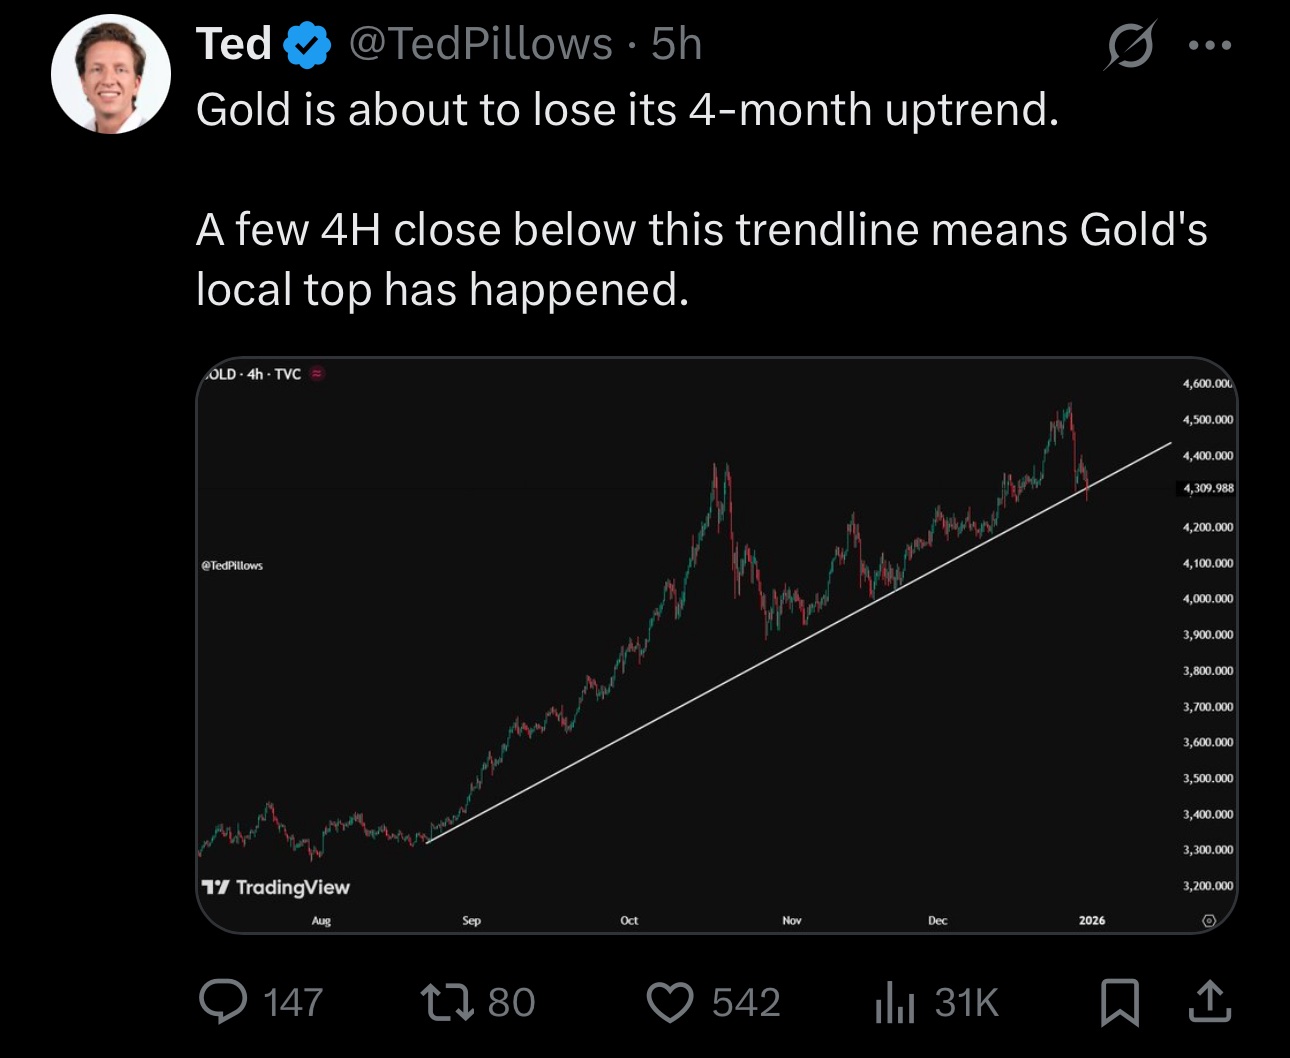
Gold hasn't even touched its daily level uptrend support and finance accounts on X are already calling for a top
I have been writing my price thesis on gold for 2 years now, and since my call in December 2023 gold's price is up ≈125%. In the last day or 2025 my call is that this uptrend will continue.
Regarding local tops, it's worth noting that gold has been in one for over 2 months now.
Additionally, closes below a seemingly arbitrary 4H support line drawn on a chart does not imply any significant top or trend reversal. Gold can go down to $3900 and still be in an uptrend!
TA & charting is supportive, as it gives you hints about what the market is doing, but on its own it can't provide you with a high-confidence prediction of the future.
If you lack the foundation on the basis of the price action of an asset, you'll find it much more challenging to distinguish a dip from a longer-term trend reversal. I've written several articles explaining why gold's price will keep going up, in terms of currency debasement, refinancing cycles, global liquidity and geopolitical pressures. You can access those threads/articles on my website free or cost. They'll provide you with a solid basis for understanding gold, where its price headed and why.
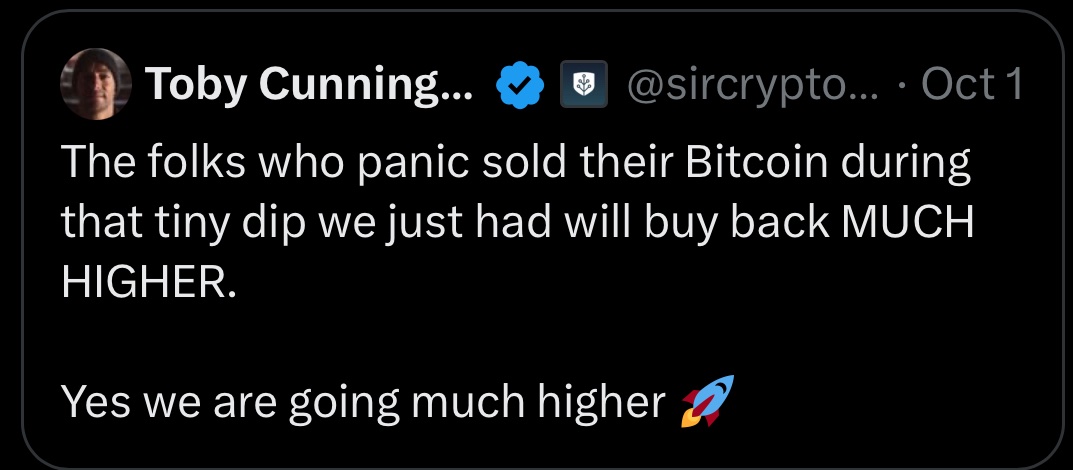
The same X accounts that were telling you to buy the Bitcoin dip on October 1st 2025, are now telling you to sell Silver on December 31st 2025
Since October 1st:
➖Bitcoin down ≈40%
➖Silver up ≈80%
Their silver top calls will age as well, as the Bitcoin dip calls earlier this year 😄
The markets gave you an early 2026 present in the form of a systemic commodity price correction - and it's up to you to take it or not
Happy 2026 🥳
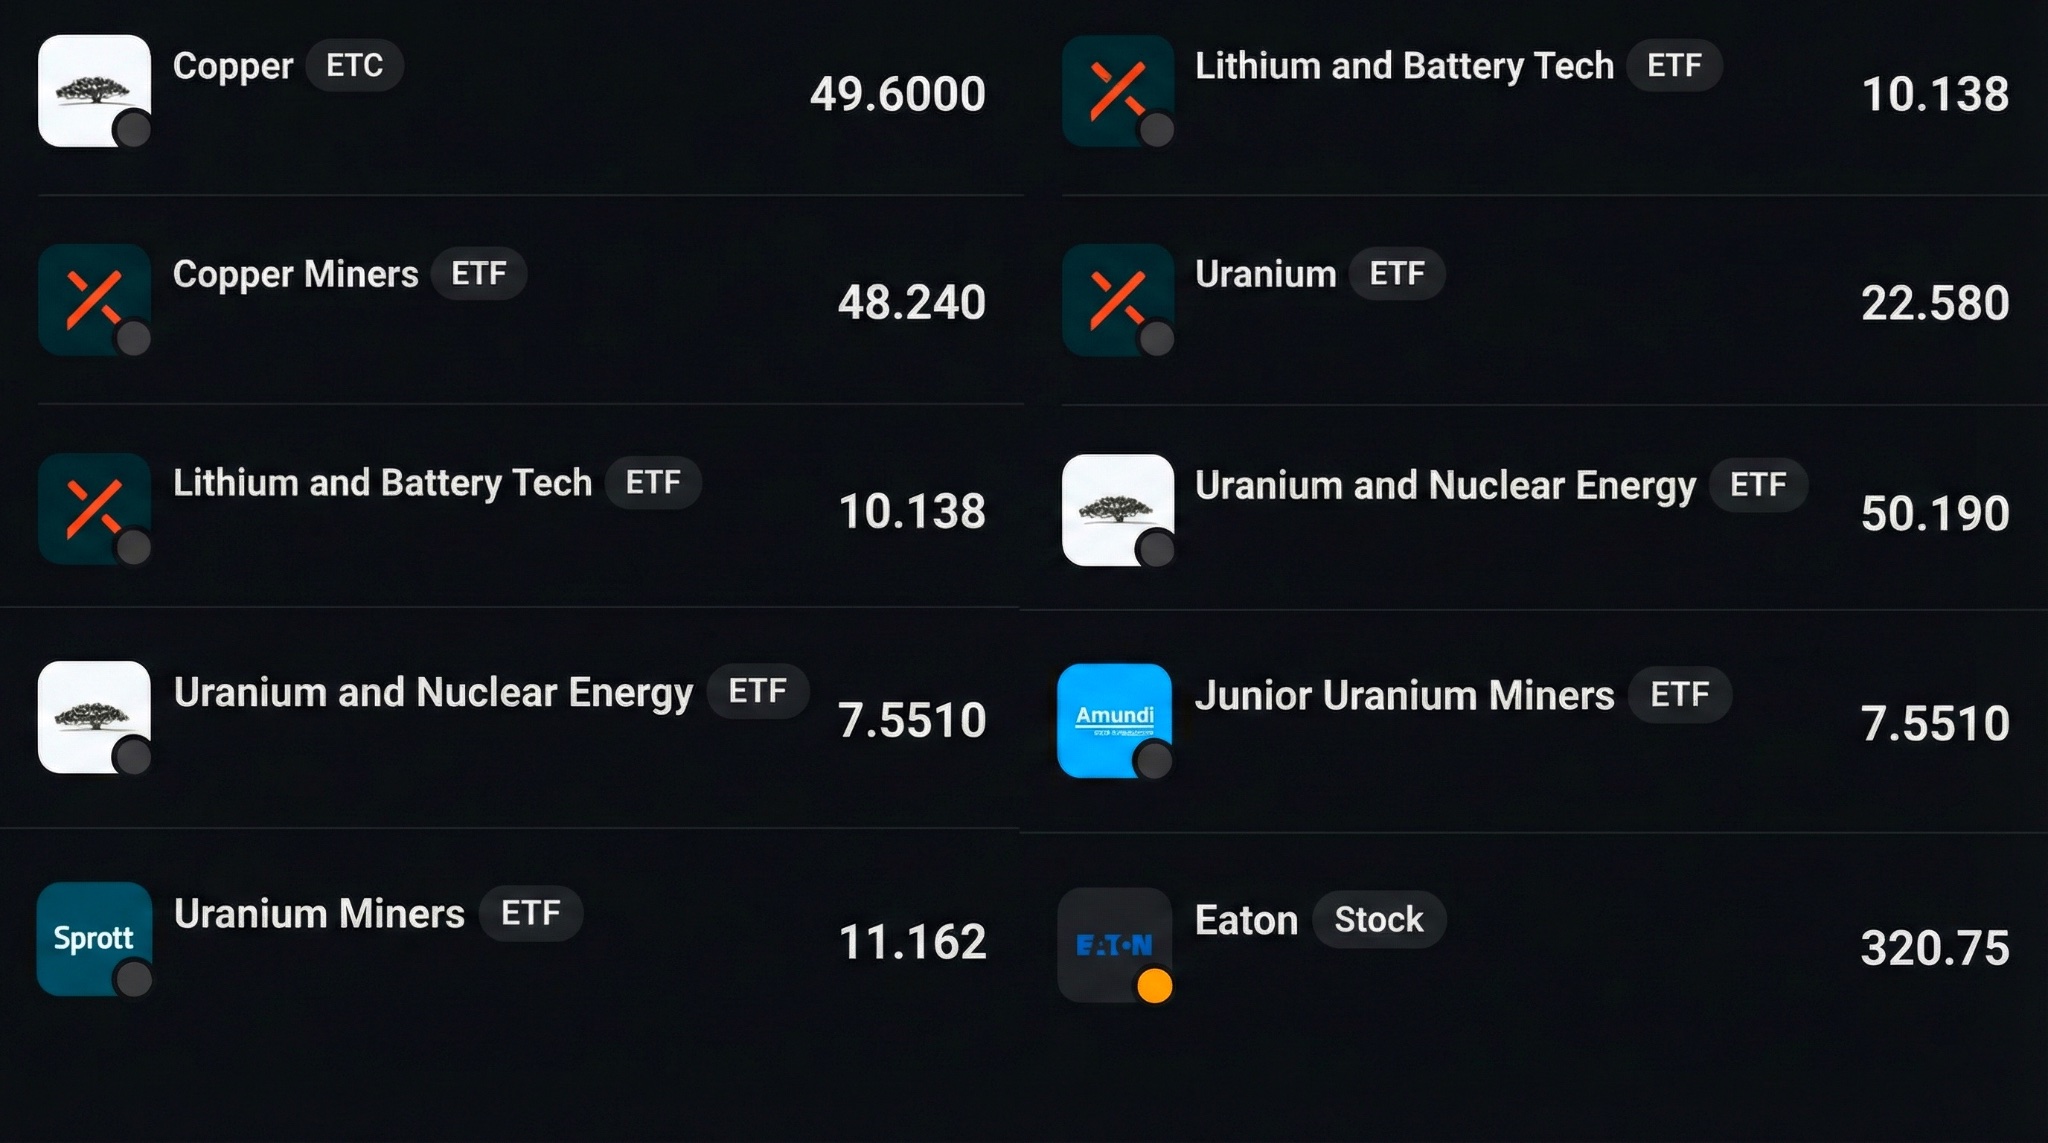
Uranium, nuclear energy, electrical grid, lithium and copper have been added to my list
Electrification will continue to increase, and that requires not only the production of electricity, but also the setup of all of the electrical infrastructure. AI runs on electricity, data centers need electricity and strong demand for electric lithium-battery powered vehicles (EVs) is here to stay for at least another decade.
You can invest in them using your favorite broker - there's plenty of ETFs, ETCs and equities.
For Uranium and nuclear energy - there are several ETFs that give you exposure to producers, distributors and infrastructure (e.g. nuclear plant maintenance).
Electrical grid investments can be done by acquiring equity in companies that expand and maintain it.
Not recommending any particular investment instruments, but the attached image provides you with a starter list.
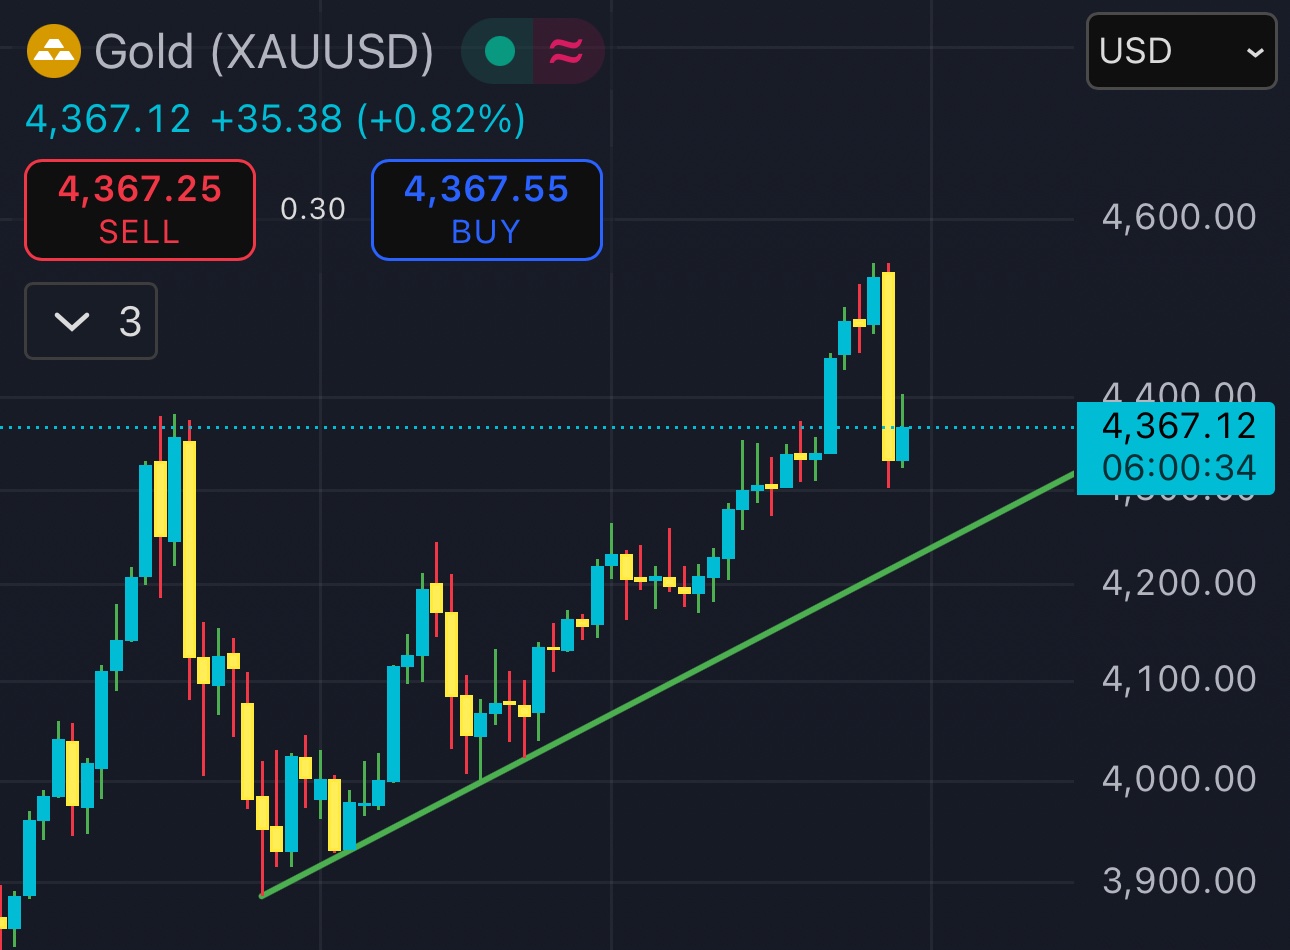
Gold hasn't even touched its daily support line from October 2025
In fact, gold price could fall under $4300 and still be above that support (green line on the chart).
This discounts all theories suggesting a long-term top at current price levels. Gold's price action clearly suggests the continuation of the uptrend into 2026.
This dip is a buying opportunity
Silver didn't even break its 4 hour trend support on the pullback and many are already calling that it has topped for the cycle 😂
M2 Money Supply Is A Bad Measure of Global Liquidity
If you're using M2/M3 as a measure of global liquidity, you're under accounting for at least half of "global money supply".
Here's some USD-centric data:
➖ U.S. M2 supply: ≈$23T
➖ U.S. Money Market Funds: ≈$8T
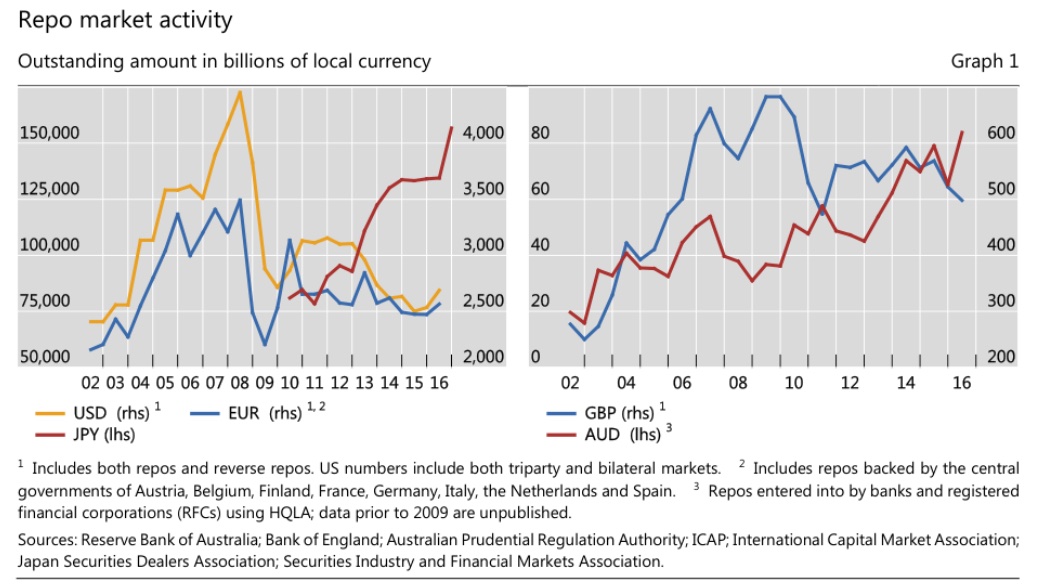
➖ U.S. Repo Markets: ≈$13T
These are USD/U.S. focused figures, so they don't account for global liquidity per se (e.g. PBoC's balance sheet is larger than Fed's), but they do show how M2 falls short of being an accurate proxy for the measure of global monetary/currency supply.
I've written several articles on global liquidity and how to measure it. You can read them free of cost in the threads section of my website.
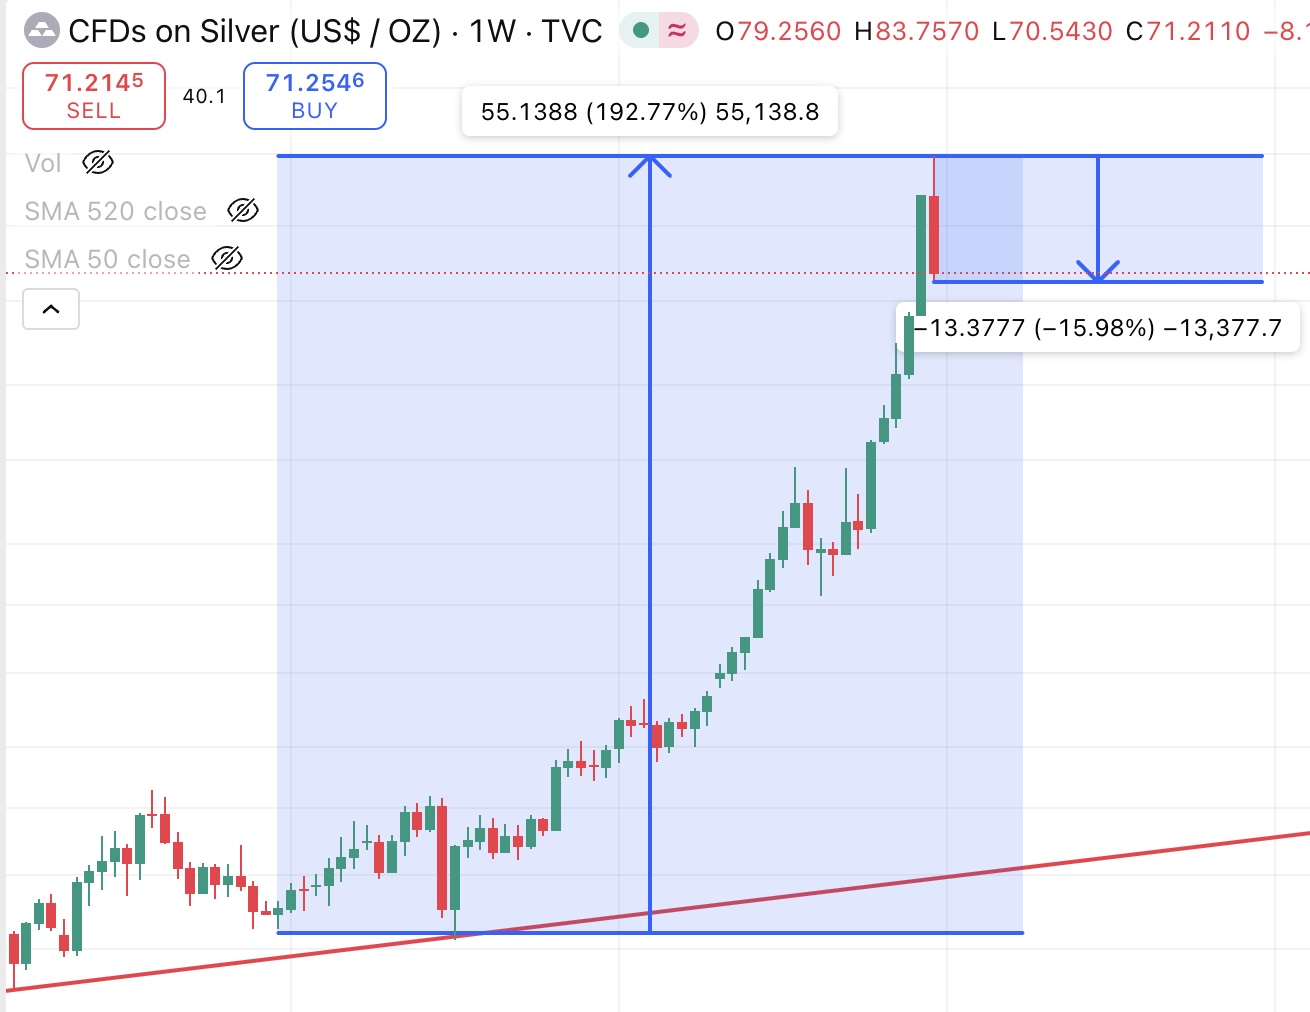
Silver is up ≈193% in 2025, but it only takes a ≈16% pullback for large finance accounts on X to suggest it has topped 😄
No, it's not the top for Silver yet and it's not hitting $50 this week
The current pullback in the price of silver & silver miners is a buying opportunity